Curiosity stole an hour of my morning … I intended to update only the Crozet “When do homes come on the market†spreadsheet, got lost there for a bit and decided to look at the Charlottesville MSA numbers.
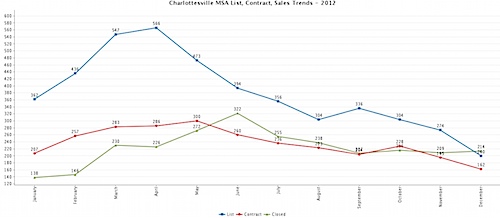
2012’s Charlottesville MSA sales trends – looking at when homes came on the market, when they went under contract and when they closed.
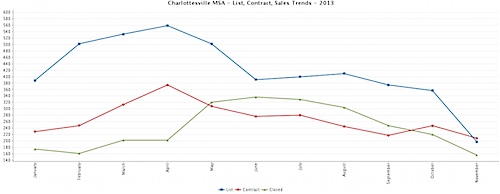
And 2013
Well, this is interesting.
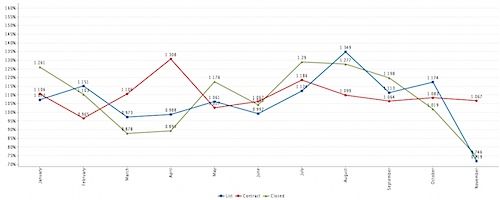
And the differential between 2013 and 2012.
For the data junkies, here’s a quick look at the numbers for 2012 and 2013 –
Keep in mind that the above numbers do not include new construction “paper listings†– proposed new construction.
Here’s why:
– In the Charlottesville MLS for the MSA (Charlottesville, Albemarle, Fluvanna, Greene, Louisa, Nelson)
– There are 1879 homes on the market
– Of those, 363 are marked as “proposed†– meaning they don’t exist as of yet.
I’ll have more analysis this week, but I’m trying to wrap up and publish by tomorrow my monthly note.


Man, Jim, I consider myself a sharp guy but I barely understand the last chart. I get that it’s a year-on-year comparison. The first two took some brain-stretching.
Basically in Jan 2013 there were 26.1% more closings vs. Jan 2012? What’s the takeaway? Earlier listing pays off with the perception of a more stable market? It’s interesting. I guess I’d have to see a few years’ worth of the same data to get a useable takeaway. 2013 (or 2012) could just be an anomaly.
Takeaway is simply that:
– Inventory is trending lower than last year, new listings are trending lower and contracts appear relatively steady
– If you’re looking to list, now might be a good time as there’s less new competition, but more overall inventory.
– Need more data. This is a snapshot of right now; as I’ve said for years, I’ll know in 18 months what today’s market is doing.
My take on the “data junkie” spreadsheet is that you had quite a few new listings in October and November ’13 which has increased the inventory in November dramatically. It also appears if sellers, who were desperate to close before year end, dramatically reduced their accepted sales price which would account for the unprecedented 12% price reduction.