April 2010 has felt like more listings have been coming on the market and more have been staying on the market than in previous years. But, feelings don’t necessarily matter so I’d rather look at the data. Looking purely at the data , a greater percentage of active listings in the Charlottesville MLS have gone under contract this year versus 2009. … Should you rush out and buy a home today because the tax credit is ending?
Browsing Category Friday
Friday Chart – Homes listed in April in Charlottesville MSA
Looking at the type of home listed in the first 15 days of April in the Charlottesville MSA* over the past few years … Of the 325 properties that have come on the market in the first 15 days, 13 are listed as being short sales. That’s ridiculously inaccurate (using anecdotal evidence). See all Friday Charts
Friday Chart – Million Dollar Charlottesville Homes
Looking at the first 77 Days of the past six years … Just in Albemarle County, these are the number of homes with asking prices over one million dollars that have gone under contract in the first 77 days: In Charlottesville and Albemarle County: All told, the “million dollar” plus category has been a relatively small segment of the Charlottesville area real estate market, and from a high-level view seems to be relatively stable. More analysis to come … See all Friday Charts
So … the Homebuyer Tax Credit Costs (way) More than $8k per House
From Calculated Risk : (bolding mine) This is no surprise and suggests that the extension and expansion of the home buyer tax credit will probably cost taxpayers over $100,000 for each additional home sold. … Buyers – are you waiting until after the tax credit expires ? Congress – will you pander some more with tax dollars and attempt to extend the tax credit for a fourth time ? Since 1 January 2010*: 373 residential properties have gone under contract in the Charlottesville MSA. 108 – 29% – are under $200k 168 – 45%- are under $250k 218 – 58% of homes that went under contract since the first of the year are under $300k. 70 – 19% – are between $300k and $400k 35 – 9% – are between $400k and $500k 40 – between $500k and $999k 12 – over $1 million * “Now” is 7 am on 5 March 2010 * I’ll turn this into an “official” Friday chart this evening.
Friday Chart – Charlottesville & Albemarle – February Homes Under Contract
We’ve been talking recently about what the effects the various snowpocalypses have had on the Charlottesville real estate market; people were snowed in, buyers couldn’t get out to see houses (yet another argument for high-quality photos and videos in the Charlottesville MLS), sellers couldn’t get their houses ready or activated on the market … the consensus has been that February 2010 was going to be a pretty sorry month for home sales. … This clearly does not account for canceled contracts, contracts that fall apart due to home inspections, financing or appraisal issues …
Homes – single family, attached and condos – that went under Contract in February in the Charlottesville MSA* Homes – single family, attached and condos – that went under Contract in February in Charlottesville and Albemarle – 12 condos went under contract in February. 8 were foreclosures or short sales. … For Charlottesville and Albemarle in February 2010 for far: – 2 were new construction attached – 31 were resale attached – 0 were new construction single family detached – 64 were resale single family detached – 12 were condos – 0 were new construction condos (and yes, I added the above manually and they match the spreadsheet. 🙂 ) Charlottesville MSA for these purposes includes Charlottesville, Albemarle, Fluvanna, Greene and Nelson
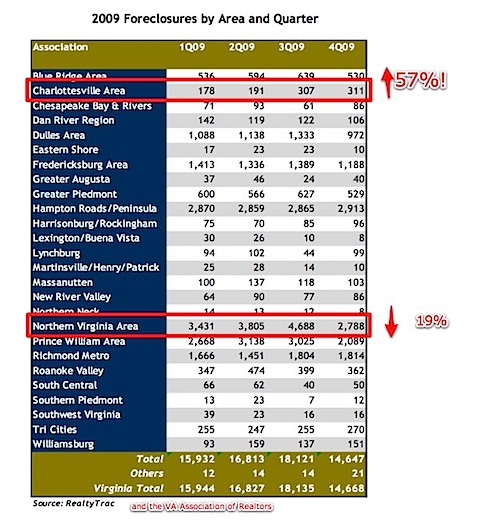
Friday Chart – Foreclosures in Charlottesville MSA
This concerns me; if only because finding accurate and relevant data for the Charlottesville real estate market is getting harder and harder; thus, advising my clients is becoming more and more challenging .
 I was on the radio with Coy Barefoot the other day discussing the Charlottesville real estate market. If you follow me on Posterous, you may have already heard the segment ; you may also listen to the show at Charlottesville Podcasting Network . Thanks to VARBuzz .
Friday Chart – Vacant Homes
2010 Third Quarter 2009 See all Friday Charts here.
