A lot of homes in the Charlottesville area are going under contract quickly. A lot aren’t. Your market will vary.
Browsing Category Market statistics
Nest’s 2014 Market Report
Read the report, digest, ask questions. I won’t bore you by pulling out stats here in the post; you’re intelligent. Download it for yourself … generally: the market is stabilizing to improving. Download Nest’s 2014…
Charlottesville’s Spring 2015 Market is Just Around the Corner
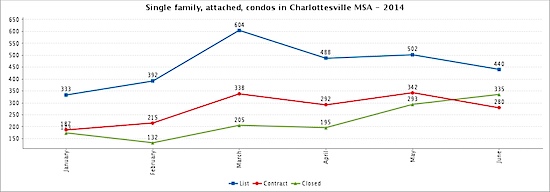
A quick look back at when homes came on the market in 2014. Looking at single family, attached and condos in the Charlottesville MSA: (click image to embiggen) Questions about the Charlottesville market? Email or call…
2014’s 3rd Quarter Market Report – Answering “How’s the Market”?
Download the 2014 Q3 Charlottesville Market Nest Report.
The #1 Question buyers and sellers ask – whether in the conference room, the coffee shop, beers or dinner, is “how’s the market?” The underlying question tends to be a variation of, “can I sell?” or “should I sell” or “can I buy a home” or “should I buy a home”?
Update: NBC29 had a nice report last night and I’ve immensely glad they used what I’ve been saying for years –
“Get advice on what this report means to them because the report gives them good guidance but every market truly is extremely localized. The Charlottesville and Albemarle areas can vary neighborhood by neighborhood, street by street,” Duncan said.
For example –
I was pulling some data this afternoon on condos in the City of Charlottesville. Comparing 3rd Quarter 2014 with the 3rd Quarter 2013, condo prices in the City were up about 15%. But. Looking at the data a bit more granularly:
In 3rd Quarter 2013, 32 condos sold in the City versus 22 in the 3rd Quarter 2014 … and one sold in this 3rd quarter for $1.1 million, with the next highest sold price being $485k. Compare that with the 3rd Q 2013 where the highest sold price was $450k.
The data matters, but the context – and relevance to your particular situation – matters more.
The below reports will provide some top-level insight, but be cautioned … top level analyses provide just that – insight into what others are able (or unable) to accomplish.
More digging to be done, but for now here is CAAR’s 3rd Quarter Market report.
The Nest Report will be released a bit later today has just been released – Download the 2014 Q3 Charlottesville Market Nest Report.

Mid-Year 2014 Charlottesville Area Market Update
This is from my monthly note … I don’t often post here what I write there, but am making an exception.
We’re at the halfway point. I think the market can be summed up thusly: Buyers are buying, sellers are selling, but there is, and has been, an underlying mistrust of the market by both buyers and sellers. A lot of buyers were burned or saw their friends or parents burned in the previous market and are reluctant to take the plunge to buy. A lot of sellers remain underwater – even those who bought five to ten years ago – and are either reluctant or unable to sell. About a third of sellers nationwide are still in negative equity positions. (I don’t have access to local data). Short advice: If you need to sell and can, do. If you want to buy and have the life circumstances to do so, consider buying.
On to the data, solely for Charlottesville City and Albemarle County, respectively:*
Sold in 1st Half 2013: 246 + 695 = 941
Sold in 1st Half of 2014: 259 + 683 = 942
Flat market, right?
Looking broadly at the data, one can reasonably and simply conclude that when prices go up, sales go down and when prices go down, sales go up. In the City of Charlottesville for single family homes, 19 more homes have sold so far this year than last year’s first half, but June’s median price is down about $5K. The County’s market is equally odd; 26 fewer homes have sold in the first six months than last, but June’s median price is up by about $28K. Huh?
Micro markets matter.
Broad trends – even at the locality level – can be misleading. I’ve been advising clients (and writing and writing) that national data, while good for headlines, matters little when making buying or selling decisions in the Charlottesville area. If you’re looking to make a decision, analyze your micro market.
For example, the $475K – $600K single family detached market in the Brownsville and Crozet Elementary districts: There are 64 such homes under contract in Albemarle County; 38 (59%) are new construction. In Crozet, there are 22 homes in that price range under contract; 18 (82%!) are new construction. If you’re trying to sell a home in Crozet in that price point, your primary competition is new construction and you need to prepare and price with this in mind. In contrast, in Baker Butler and Hollymead Elementary school districts (29 North region), there are 46 single family homes under contract and four in the $475K – $600K range and all are resales. Micro markets are far more relevant than county-state-national market data (or zestimates).
Broadly, we might be witnessing a balancing of the market. I’ll let you know next year what today’s market is doing.
(All of my PDFs are here, if you’re curious and/or you want to fact-check me. Please do; I’d appreciate constructive criticism.)
The inventory question:
In the Charlottesville MSA (Charlottesville, Albemarle, Fluvanna, Greene, Louisa, Nelson), 2,759 homes have been listed so far this year versus 2,876 last year, which is a small enough difference – about 5% – that I’m going to call the new listing numbers mostly flat.
Have questions about the market? Curious what your home might be worth? Thinking about buying? Call or email me anytime – 434-242-7140.
Update 12 July 2014: We at Nest Realty have released our First Half 2014 market report. Download it here; it’s a brand new format – I/we hope you like it!
Update 14 July 2014: I wrote a brief market report specifically for Crozet, Virginia; it’s a highlight that micro markets matter.
1st Quarter 2014 Nest Report – Sales Down, Fundamentals Stronger
Have a few minutes? Curious about what happened in 2014’s first quarter in the Charlottesville real estate market? Spend a few minutes reading our 1st Quarter 2014 Nest Report.
My suggestion? Read, digest, and then ask questions about how the market data and report pertain to your situation.
A Short Look at the Charlottesville Real Estate Market – April 2014
Remember the $8,000 homebuyer tax credit? Remember how it pulled demand forward and compressed the 2010 real estate market (in Charlottesville at least)?
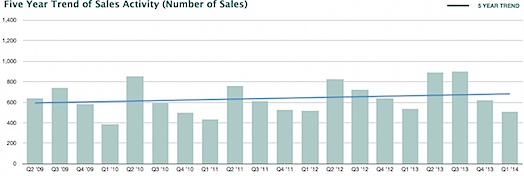
In trying to figure out the first part of 2014, that’s the best sort-of-analogy I can make. So far, things are looking less awesome than they would appear. There are so many nuances that I tend to look at for clients – new construction versus resale, proximity to whatever it is that is important to them and that particular sub-real estate market, interest rates, ability to walk or bike to groceries and more. But. For a brief high-level look –
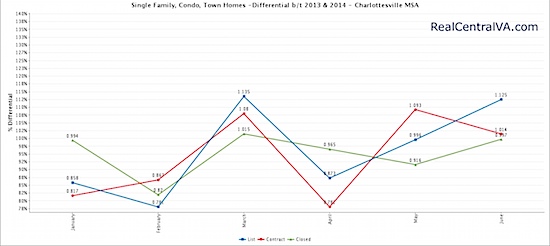
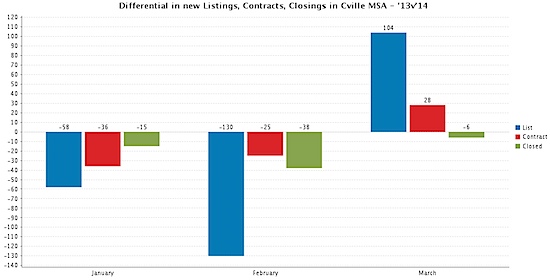
It looks like the first two months of 2014 were slower than the first two months of 2013 and March is when the market starts to pick up.
Remember – “Normal” is “Now.”
Still trying to figure this out …


