As with some stories I post here, I’m posting for two reasons. First, I want to educate and inform those who read (thank you) and second, I refer to my blog all the time – and it’s much easier to google my blog than my brain. For now.
I’ve been looking at some national trends lately and how they affect home buyers and sellers. Lawrence Yun, NAR’s chief economist, has been very candid lately. (he also noted a few years ago that there were too many Realtors)
Hearing this story on NPR yesterday was timely, as the two economists echoed what I’ve been thinking for the past few weeks:
Lawrence Yun has been crunching numbers too. He’s chief economist at the National Association of Realtors. He says for the last six months, fewer than 30% of all home sales were to first time buyers.
“And this is historic lows,†he says. “Typically it should be about 40% to 45%. And I believe the key reasoning is that many of the younger households, they are saddled with student debt.â€
Which makes it harder to qualify for a mortgage.
But before we wag the finger at student loans, there may be a twin culprit. Rohit Chopra is the student loan ombudsman for the Consumer Financial Protection Bureau. He says student loan burdens are rising much faster than wages.
“Real wages when adjusted for inflation have actually been flat for new college graduates for about the past ten years. So young people have more debt but are earning the same or less income,†he says.
From what I’ve seen in my real estate practice, the home buying cycle is slowing down. First time homebuyers are now buying at later stages in life. As noted a couple years ago, the 0-5 Buyer is Gone. And right now,
First time homebuyers, when they do choose to buy, are buying at later points of their lives – once they’ve established themselves in their careers* and found their mates if they so choose, and have determined that their lives – kids on the way, jobs … have or represent some sort of stability.
Many of these first-timers have either seen their friends and families decimated by the housing market or have experienced it themselves in selling or trying to sell – either normal transactions, short sales or foreclosures.
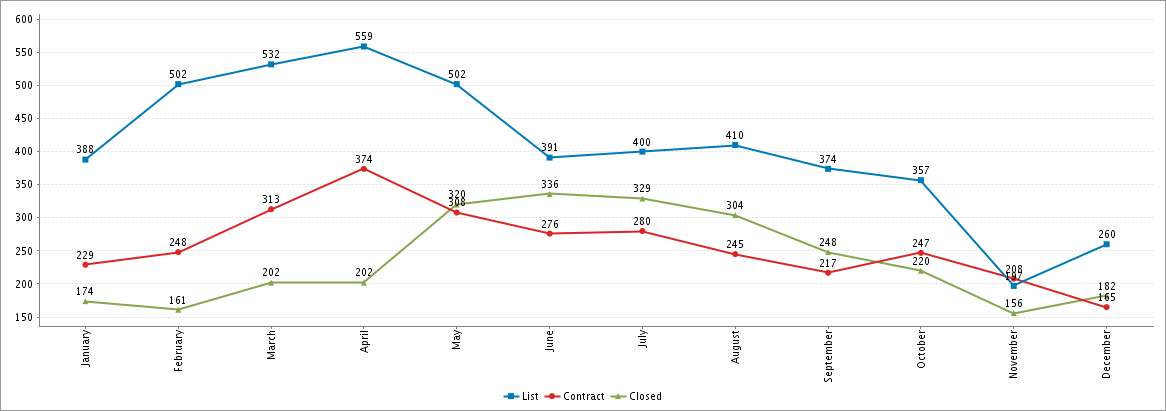
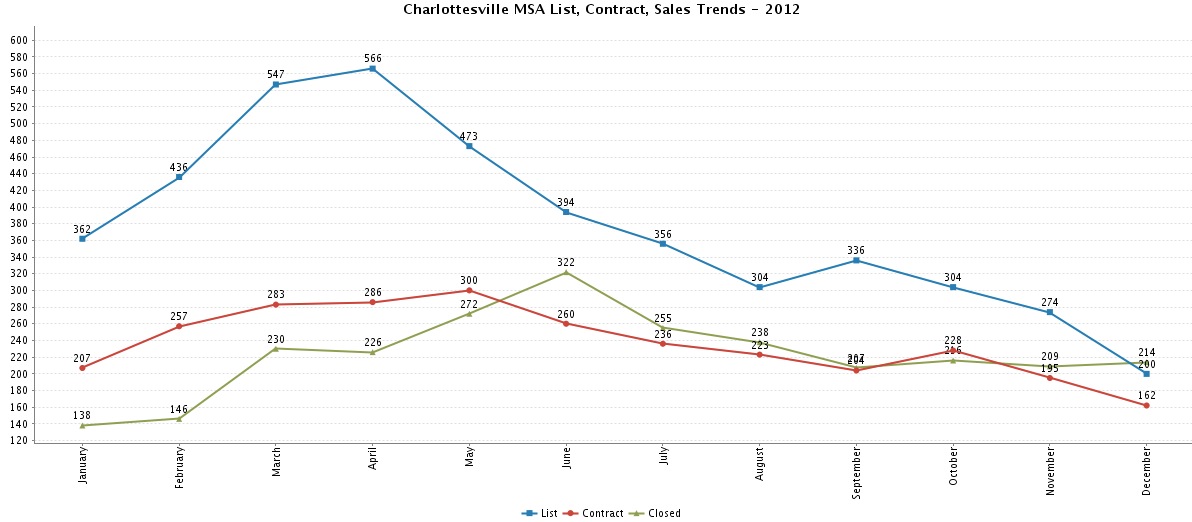
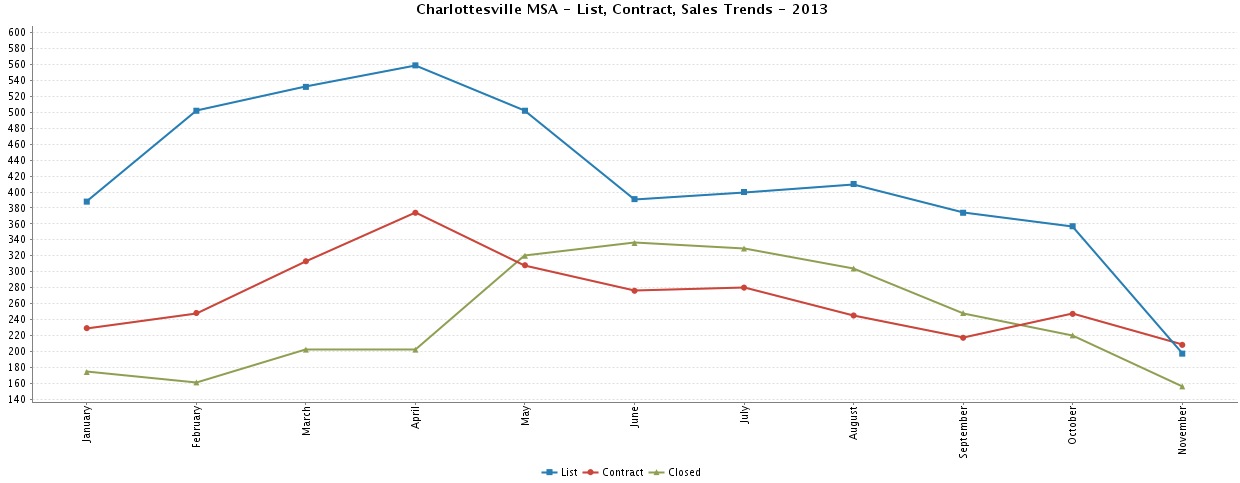
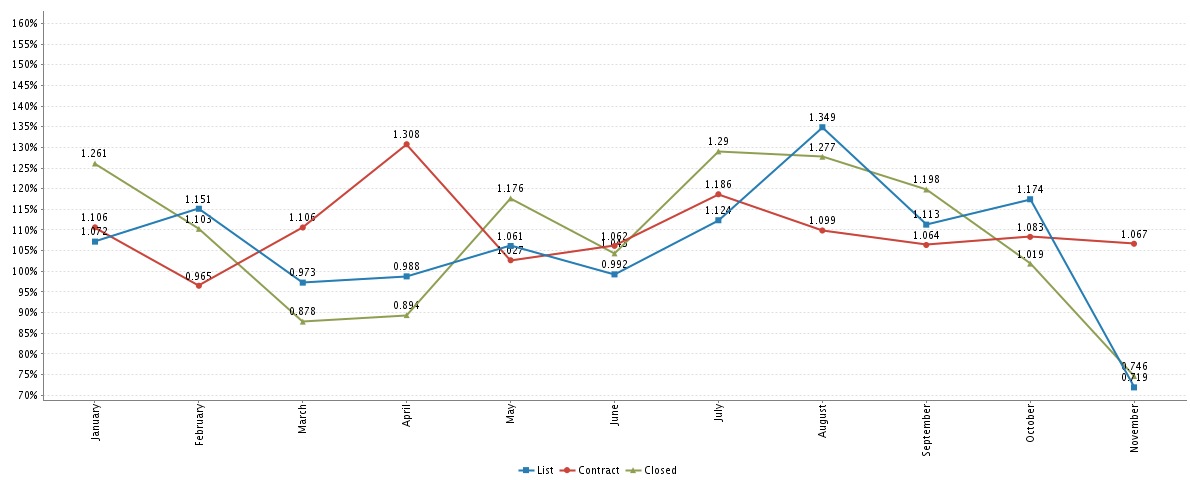
As I noted in my monthly note, so far I (and others) have been wrong about the inventory coming to the market in the Charlottesville area. March and April should prove telling. If more quality, well-priced homes don’t come on the market in those months, I suspect that we’re going to see reduced home sales for the entire year. Keep in mind that “new normal†is another way of saying “today.”