Download the PDF of the November 2011 here
I’m working on data and analysis, but wanted to get this out today. Lots more PDFs after the jump.
Charlottesville's Real Estate Blog. Buyer &/or Seller Representation, Real Estate News
Download the PDF of the November 2011 here
I’m working on data and analysis, but wanted to get this out today. Lots more PDFs after the jump.
I’ve tried to write this story about the National Association of Realtors’ revisions and I can’t seem to write anything new that I or others haven’t said before.
@mortgagereports How will they help? More accurate data is good, but who trusts the NAR? My take is: national is irrelevant,local is crucial
There’s a bit more after the break, but the above sums it up.
Case Shiller doesn’t track the Charlottesville real estate market. Nor Albemarle, Greene, Fluvanna, Nelson, Waynesboro, Augusta … Case Schiller doesn’t track Charlottesville.
I wrote in early 2008 that The Charlottesville/Central Virginia/Shenandoah Valley markets are not covered by the Case-Shiller index. Real estate is local; while trends may be drawn from this type of research, and while the proverbial turned-corner may still be just over the horizon, it’s important to put his study in the appropriate context.
Crap. That “horizon” to which I referred is still a ways off. But … what I said remains true. Case Schiller doesn’t track our market.
But.
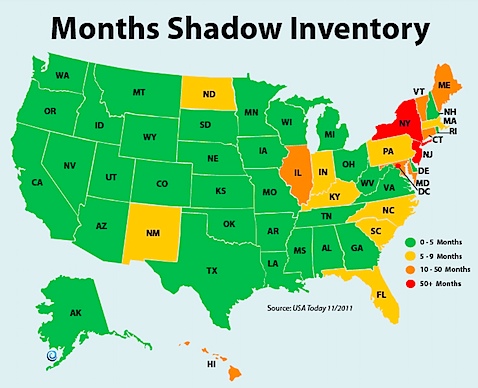
I haven’t done a Friday Chart in a while, but this struck me: This is a chart showing the inventory for Scripps Ranch in San Diego, courtesy of one of the best writers I know,…
What’s old is new again.
To which I say: so what? I have yet to see relevance in their data, and I have never heard one of my clients reference their forecasts or recaps.
If you’re surprised (really?!) the NAR overestimated sales, you haven’t been paying attention for the past decade.#realtors
Calculated Risk said in 2007 about the National Association of Realtors:
I think their forecasting model is broken.
My thoughts then are still relevant.
And CR said noted last week the NAR’s press release which stated:
NAR presently is benchmarking* existing-home sales, and downward revisions are expected for totals in recent years, although there will be little change to previously reported comparisons based on percentage change. There will be will be no change to median prices or month’s supply of inventory. Publication of the improved measurement methodology is expected in the near future.
Earlier this year, I noted that folks paying attention to the national and local real estate markets really need to just ignore the NAR’s numbers.
The National Association of Realtors is a trade organization. Not an unbiased news (heh. do those exist?) organization. Remember that.
One big notation: I’m no longer comparing today’s real estate market; what happened in 2005 – 2007 and before is interesting, curious, anomalous and ultimately irrelevant to today’s real estate market. EVERYTHING is different now – interest rates, economic outlook, international economic events, gas prices, employment trends – making comparisons between this market and that market is a distraction.
The City of Charlottesville’s real estate market is unique – its mix of homes – single family, condo, townhouse, the fact that is has a relatively smaller percentage of newer construction and its more dense and urban location make it quite distinctive from the surrounding markets.
First, the bullet points:
– Active Listings – Fewer than last year, but still too high.
– New Listings – Fewer than the past two years and trending down; this is a very good thing. As fewer houses come on the market, more houses will sell and we’l be able to find our way through the current spate of houses on the market. *
– All Pendings (Under Contracts) – Higher than the last two years; this is a very good thing. People are buying real estate.
– New Pendings (Better reflecting current market activity) –
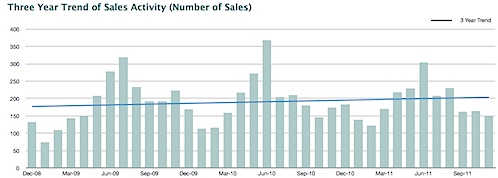
– Sold Listings – Slightly higher than last year.
I’d love to include the numbers and charts for Days on Market and the List Price to Sales Price ratio, but I have found that the only, only, only way to run these numbers with any degree of accuracy is to do it manually. For specific properties and neighborhoods.
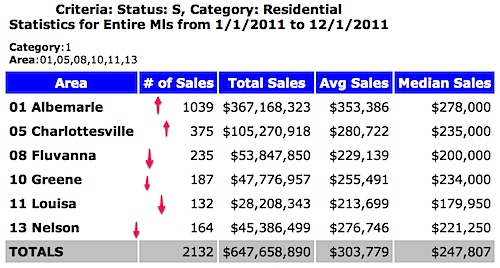
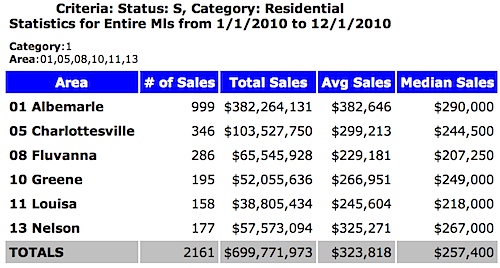
Note also that these numbers and charts are for everything – single family, attached and condos – your market will vary.
* I’m not totally convinced that the houses that are coming on the market in the Charlottesville and Albemarle real estate market are the ones that buyers want to buy – whether size or energy efficiencies, I think that the inventory we’ve seen over the past 18 months has not quite matched to what buyers want, and this is a reason that we’ve seen the new construction market in the Charlottesville area do so well.
Now, the charts and graphs …
One big notation: I’m no longer comparing today’s real estate market; what happened in 2005 – 2007 and before is interesting, curious, anomalous and ultimately irrelevant to today’s real estate market. EVERYTHING is different now – interest rates, economic outlook, international economic events, gas prices, employment trends – making comparisons between this market and that market is a distraction.
First, the bullet points:
– New Listings – Fewer than the past two years and trending down; this is a very good thing. As fewer houses come on the market, more houses will sell and we’l be able to find our way through the current spate of houses on the market. *
– New Pendings (Better reflecting current market activity) –
– Median Sales Price (for all properties) – Lower than last year, trending up.
* I’m not totally convinced that the houses that are coming on the market in the Charlottesville and Albemarle real estate market are the ones that buyers want to buy – whether size or energy efficiencies, I think that the inventory we’ve seen over the past 18 months has not quite matched to what buyers want, and this is a reason that we’ve seen the new construction market in the Charlottesville area do so well.