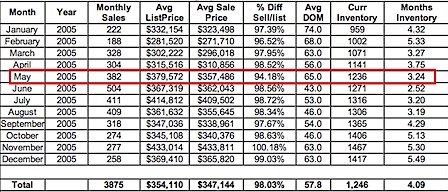
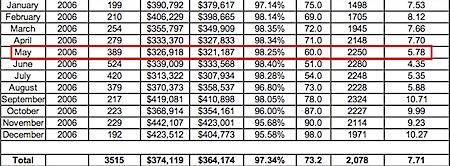
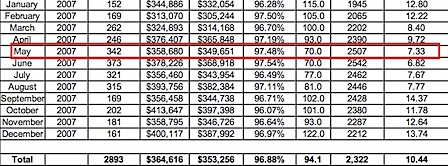
“Basically what we all do now is go home, get out of our cars, close the garage door, and most people, if they’re lucky, know who’s beside them, but they don’t know who’s two houses up. … An automatically-generated analysis (via the Charlottesville MLS) of six representative properties in Albemarle County looks only at the difference between the Final Listing Price and the selling price, not the difference between the Original Listing Price and the selling price:
Browsing Category Market statistics
Charlottesville and Albemarle Sold properties by price range
As promised last week and with apologies for the delay, this is the breakdown by price range of sold properties in Charlottesville and Albemarle for the first quarters of 2004-2008.
… This is just for sold properties; I do analyses of inventory levels, absorption rates and number and percentage of under contract and withdrawn (likely due to rental) properties for my clients or for “paid-for” deeper analyses .
Charlottesville Area Market Update – June 2008
——————————- The Agent Update In 2007: From January through the end of May, 158 Realtors had more than 5 sides 45 had more than 10, and about 700 had not had one transaction In 2008: From January through the end of May, 74 have had more than 5 sides 24 have had more than 10, about 900 have not had one transaction Any Realtor who is not at least a little bit concerned about survival either isn’t paying attention or isn’t a full-time Realtor. … I didn’t know how long we’ve been in this cycle until I referred to this story – Sold Comps now matter less – from February 2007; and was a bit shocked that it had been so long since I had written it. 2005  2006
2006  2007
2007  2008
2008  ——————————- Median Prices of sold properties* – May 2008 – $274,000 May 2007 – $287,000 May 2006 – $264,000 May 2005 – $255,000 May 2004 – $227,998 ——————————- Outlook/projections : I have been saying that the recovery is nine to eighteen months away for nine to eighteen months.
One line market observation
When telling buyer clients how long a property has been on the market, saying “February” is not sufficient; I have to specify which February. 312 properties in the Charlottesville market have been on the market for more than one year (that’s about 13% of the inventory).
Charlottesville market report coming Monday
While I had planned to release the market report for the Charlottesville market today, I have noticed that even properties that closed ten days ago have not yet been closed in the MLS. In an attempt to provide the most accurate data, I’m going to wait until Sunday afternoon to write the report. (and I still need to find the best report to present the median price) Thanks for your patience.
Foreclosures in Charlottesville and Albemarle
Let’s see some localized context, courtesy a report titled ” Cumulative Foreclosure Actions In Virginia (April 2008)” sent to me by a local lender ( PDF ) – Albemarle County is #68 with .03% Augusta County is #76 with .02% Charlottesville is #78 with .02% Fluvanna County is #98 with .01% Greene County is #65 with .03% Nelson County is 103 with 0% Waynesboro City is #87 with .01% For context, look at Spotsylvania 1.69% and 1.9% Stafford, which equals 727 and 828 housing units respectively under foreclosure. Loudoun County has over 2,000 foreclosures equalling 2.14% of their housing stock.
Median Housing Prices for Central Virginia
In response to a reader question, these are the median prices for all residential properties in the Central Virginia* region: Quick summary – 2006 was the peak year. 2008  2007
2007  2006
2006  2005
2005  2004
2004  After the break, I show the median prices for just single family homes in the region – excluding condos and attached homes. … Data for the Shenandoah Valley – Waynesboro and Augusta Counties, is just not as robust as what we have in the Charlottesville MLS – so I am unable to post their data with confidence. 2008
  2007
2007  2006
2006  2005
2005  2004
2004 
