The second quarter real estate market report has just been released by the Charlottesville Area Association of Realtors. Happy reading. 2010 2nd Qtr CAAR Market Report
Posts tagged 22901
When Evaluating the Charlottesville Real Estate Market, IGNORE National Data
Take your lede : – Home sales up 14% in Charlottesville and Albemarle year over year. – Home sales up 19% in Charlottesville MSA year over year. – Foreclosures continue to climb in Charlottesville and Albemarle. – Questions abound regarding second half of 2010; where will we find the bottom of the market? – If you have questions about or would like more detailed analysis, please contact me.
…Simple (though notsoumuch in reality) What I’m reading: – Harvard’s State of the Nation’s Housing Market (PDF) and listening to an excellent podcast with Nicholas Retsinas , Director, Harvard University’s Joint Center for Housing Studies . (did you know that there was an exhibit at the Smithsonian on McMansions ?) – Core Logic’s Home Price Index Report for April 2010 – Virginia’s Housing Price Index, for single family homes year-over-year, is up 6.5%; for single family homes excluding distressed properties, is up 3.6%. Virginia is one of the five best states for year-over-year price appreciation excluding distressed sales .. but mostly that’s irrelevant in my opinion as the bulk of those sales are most likely comprised of Northern Virginia sales. – The Federal Housing Finance Agency’s House Price Index for First Quarter 2010 The FHFA (formerly OFHEO) say that in the Charlottesville MSA house prices have dropped 6.98% year over year, 1.86& in the 1st Quarter 2010, and have appreciated 12.68% over the past 5 years .
… Home Sales are Up 19% year over year in the Charlottesville MSA: 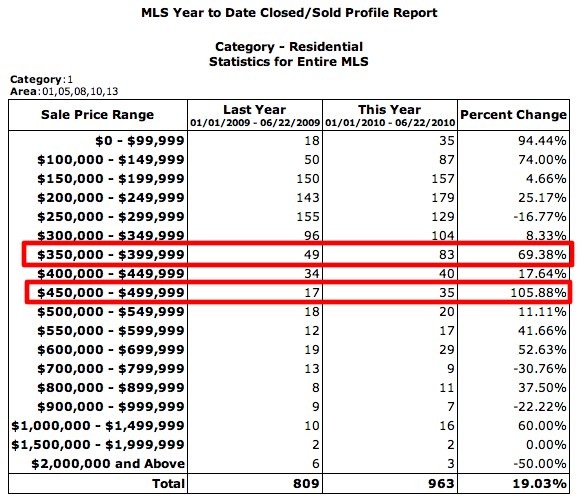 Homes sales are UP 14% in Charlottesville and Albemarle :
 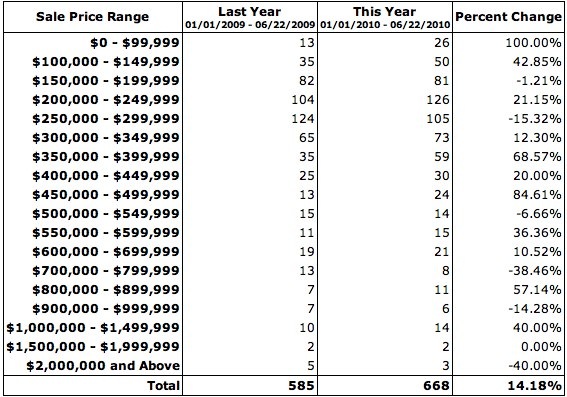 One point: Charlottesville’s Unemployment is lower than the national average.
 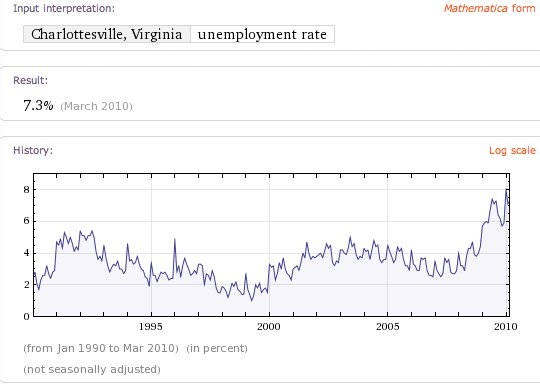 Prime example of the irrelevance of national, aggregate housing data, which is good only for political talking points and respective agendas: Foreclosure starts for the nation and Charlottesville and Albemarle: National foreclosure data, courtesy of the HUD Scorecard, using RealtyTrac data:
 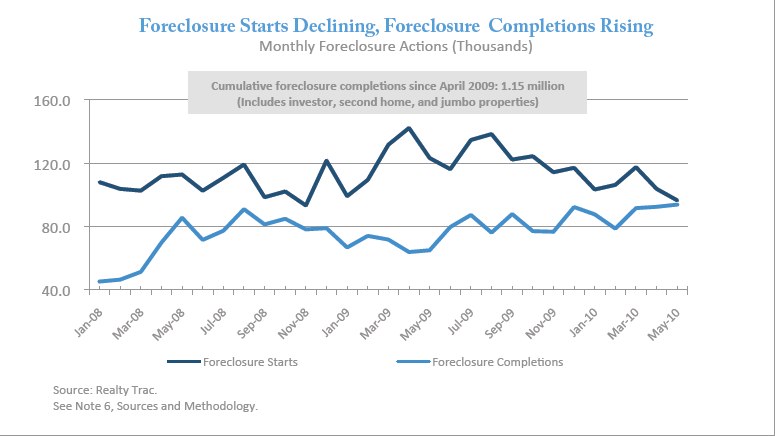 For Charlottesville, using RealtyTrac :
 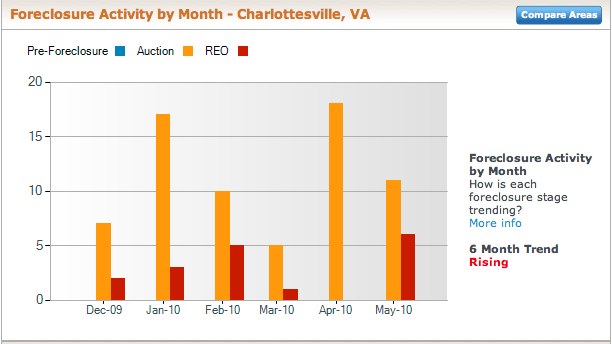 For Albemarle County, using RealtyTrac:
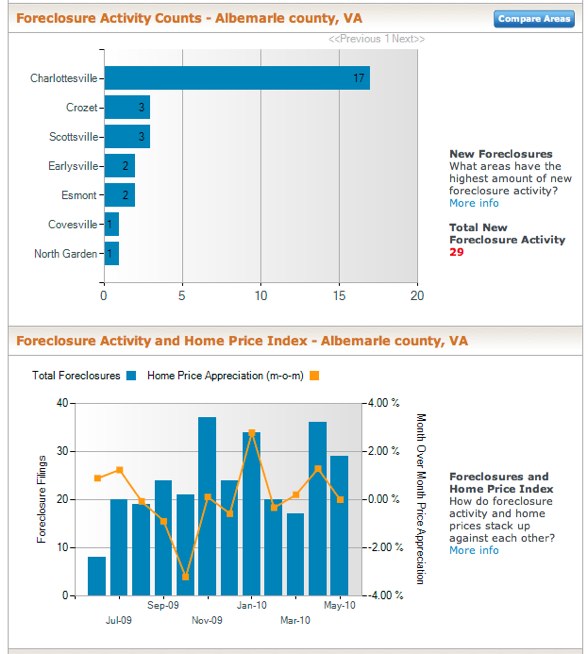
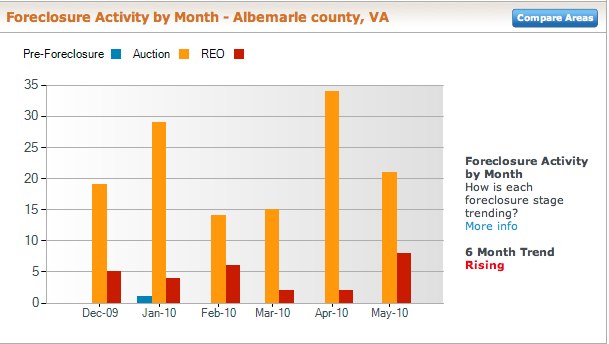
 What have median home prices done in Charlottesville over the past five years?
Albemarle Place Progressing?
Albemarle Place is moving through the Planning Commission . Of course, it was “back on track” in 2008 . It’s going to be elegant .
Dealing with Home Buyers’ New Psychology
When we started, we were looking at new construction, and I had to tell them that whatever they wanted changed would have to be done by them, at their expense after closing, as the builders were not going to make any concessions or alterations. … That’s a difference that matters – both to actual sales numbers and perceived sales numbers – to the market’s collective psyche, if you will. See for yourself (PDF). Add to this the fact that the average Days on Market in May 2006 was 69 and the average Days on Market in May 2010 is 106 and the market rightfully feels slower.
…Many Sellers don’t want to “give their homes away” (hint: price your home to sell from Day One ) and many Buyers want to feel like they get a “deal” and many buyers have unreasonable expectations – resale homes are used homes; they are not new construction.
…They also are prepared to walk away if things don’t go their way – there will be another house that suits their needs and wants; five or six years ago, another house would come on the market, but it would probably have been more expensive.
Pick up this week’s C-Ville – Living as a Charlottesville Local
(#10) If you’re in town, pick it up for their “Summer in Charlottesville” insert; I think it’s quite excellent. If you’re not, let me know and I’ll scrounge up a copy for you. … One or the other. 🙂 ( #15 ) While you’re there, feel free to vote for yours truly as “best real estate agent” in Charlottesville . ** why the asterisks? Because when folks refer to “Charlottesville” they typically are referring to “the Charlottesville area” – meaning Charlottesville and Albemarle, and often Nelson, sometimes Greene, frequently Fluvanna and sometimes Louisa.
Charlottesville Realtor Productivity Update
There are plenty of caveats to this post; I will be overlaying these numbers, which are based on the Charlottesville Extended MSA, with total transaction volume.
Foreclosures in Charlottesville Increasing – As Expected
Following up on the Charlottesville Bubble Blog’s noting that foreclosures in the Charlottesville MSA are up: As expected (I noted in 2009 that foreclosures in Charlottesville would likely increase ): What does this all mean from a market standpoint? Foreclosure activity is likely to increase, but we are nowhere near the foreclosure rates and percentages of the major foreclosure hotspots -parts of Florida, Phoenix, California – which account for a majority of national foreclosures. Foreclosure Data for Virginia (PDF) Look at mortgage conditions in Charlottesville at the New York Fed’s map . We’ll get through this.