Kate says that clear, definite and positive progress is happening in Belvedere: And then joy of joys, we learn a family with kids is moving in next door, one is a boy my son’s age!…
Posts tagged 22901
What is RealCentralVA?
Thanks to Marijean and WCAV for the profile during their Blog of the Week segment. Know this – some of the most informative, educational and entertaining contributions to this blog are provided by the commenters,…
Re-Visiting Thursday’s Radio Appearance on WINA
Another packed hour with Coy Barefoot on Charlottesville Right-Now! last week – I love doing radio. The time always seems to fly by so fast – – The referenced discussion with Michael and Greg. –…
The National Geographic Likes Charlottesville
And their reporter found lots of my favorite spots, too . Restaurants , vineyards , breweries , dumplings on the Downtown Mall , … it is rare that I read one of these reviews and agree with the author’s findings, but this is one of those rarities.
First Quarter Market Report for Charlottesville and Albemarle
Days on Market : Of the 1927 residential properties on the market in Central Virginia: – 584 have continuous days on market (CDOM) of less than 30 days. – 890 have CDOM of less than 60 – 1126 have CDOM of less than 90 – 1143 have CDOM of at least 180 days – 458 have CDOM of at least 365 days – 78 have CDOM of at least 730 days (I’m posting this just because I was curious, so I thought you might be, too) Answering Joe’s question from my request for “what do you want to know ” (thanks to the CAAR report):- 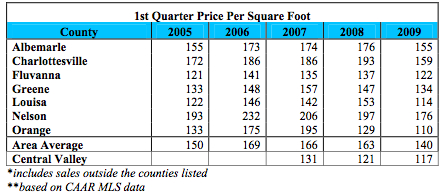 Regarding price reductions – I’m working on a way to display the sold data, but in the meantime, know this – properties that have significant (meaning at least 10%) seem to be going to contract fairly quickly.
… In Cville all categories: 1st QTR 2008 145 Contracts (54% under $300k) 1st QTR 2009 87 Contracts (71% under $300k) In ALB/CVILLE/FLU/GRN 1st QTR 2008 554 Contracts (54% under $300k) 1st QTR 2009 452 Contracts (71% under $300k) I’m no rocket scientist but I think this means when we come back and look at the CAAR report again end of 2nd QTR, median prices are going to move some more.
Sold Properties by Property Type in Charlottesville and Albemarle
A few charts to whet your appetite in advance of tomorrow’s market report:
Charlottesville Area Association of Realtors’ 1st Quarter Market Report
A balanced market should have a DOM of approximately 90, but we have not been in that range since 2006. 1st Quarter Average Days on Market County 2005 2006 2007 2008 2009 Albemarle 64 70 116 135 113 Charlottesville 72 62 75 141 167 Fluvanna 70 79 108 135 127 Greene 67 76 99 90 92 Louisa 114 119 158 110 70 Nelson 73 83 118 152 164 Orange 89 83 95 125 163 Area Average 75 80 107 132 134 Central Valley 126 143 144 *includes sales outside the counties listed **numbers courtesy of the Greater Augusta MLS New Construction Still Slow It is important to note that many “new†homes are not included in CAAR MLS statistics. … As expected, the average costs per square foot have decreased in every area covered in this report. 2005 2006 2007 2008 2009 1st Quarter Price Per Square Foot County 2005 2006 2007 2008 2009 Albemarle 155 173 174 176 155 Charlottesville 172 186 186 193 159 Fluvanna 121 141 135 137 122 Greene 133 148 157 147 134 Louisa 122 146 142 153 114 Nelson 193 232 206 197 176 Orange 133 175 195 129 110 Area Average 150 169 166 163 140 Central Valley 131 121 117 *includes sales outside the counties listed **based on CAAR MLS data Condos and Townhomes The sale of attached homes is only reported in Charlottesville and Albemarle because very few properties in this category are located in other counties, except Nelson.