Posts tagged Albemarle

Questioning the Data – 3rd Quarter Nest Realty Market Report

2013 Q3 Cville Nest Report - 5 Year Sales Trend

The third quarter of 2013 ended with a neither a bang nor a whimper, but a nice, consistent breathing pattern. As it stands right now, recovery seems to be in full swing.

I’ve said for years to question the data – whatever its source (it’s why I tend to provide raw data for readers to vet). If you’d read the market report from CAAR last week, you’d have been reading inaccurate conclusions different conclusions than the ones in our report. I won’t go point-by-point through the discrepancies (but will in my monthly note), but will say simply: the conclusions are wrong. We look at data differently using the same sources. As I’ve said for years – question everything (even the stuff I write – and ask me your questions).

Download the full 3rd Quarter 2013 Nest Report

If you watch national news you’d see:

September existing home sales fall 1.9% (USA Today)
USA Today is much the same as the NAR’s blog post
Existing Home Sales in September: 5.29 million SAAR, Inventory up 1.8% Year-over-year (Calculated Risk)
– and then we have Zero Hedge: Existing Home Sales Plunge At Fastest Pace In 15 Month As Affordability Drops To 5 Year Low

Those trends are evident in the Charlottesville area as well. As prices rise, sales volume drops.

Some quick year over year numbers for the Charlottesville area:

MSA – sales volume up 19%
Albemarle – volume up 16%
Charlottesville City – volume up 16%

Single family home prices, long the bellwether for the housing market:

MSA – up 10%
Albemarle – up 16.2%
Charlottesville – up 12.5%

Your micro market will vary.

Update: so I upset a few folks with my calling the CAAR report “wrong” and “inaccurate”. I apologize for my tone, but remain 100% confident that the numbers I and we present are accurate. We do use different methodologies when looking at the data.

I’m not trying to pick a fight and could have been more diplomatic in my original post’s tone. For that, I apologize. I cannot apologize for presenting accurate data to my readers and clients.

Read More

The Walkable City – Achievable in Charlottesville?


What would it take to make Charlottesville and Albemarle truly walkable? People who live in areas that are walkable are happier, leaner, have more money for leisure, spend more time with their families … is that really achievable in the Charlottesville area?

The answer is – the public would have to express its desire for this, the leaders would have to listen to the people, collaborate, plan and execute a vision that would enable the City of Charlottesville and County of Albemarle to create more walkable and bikeable localities. Of course, in an area that takes 30+ years to build a short Parkway, I think there’s a better chance of flying cars gaining prominence than thoughtful infrastructure being implemented.

What could be done to craft a truly walkable City/County?

Walkability matters – there are growing urban cores within Charlottesville and Albemarle and the sprawlish segmentation continues. But … what if each of these urban cores grows up and densely?

This is the original Google Map I did in 2007. I’ve updated it for today’s world. Biscuit Run is no longer planned. Albemarle Place is now Stonefield (and is built). North Pointe is far off in the horizon.

This is a map of the “town centers” in the Charlottesville – Albemarle area

(If you’re looking for homes near these, use the radius search on my search site)

Read More

3rd Quarter Market Report for Charlottesville MSA

The news and trends in the Charlottesville market are mostly good.

– Distressed sales are down (but they’re still out there)
– Well-priced homes that are turnkey are typically going under contract in under 60 days. Quality inventory remains a challenge.
– Prices seem to be up across the board.
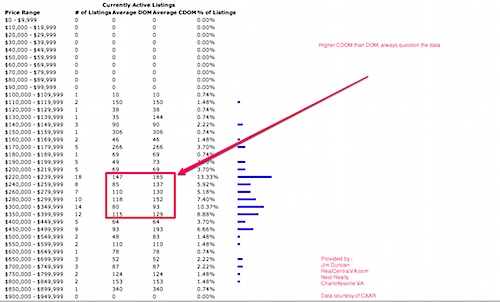
– Note that these are broad overall trends. Long-time readers know my caveats that “single family homes in Charlottesville City” means all single family homes in the City of Charlottesville … those that are priced below $200k and those that are priced above $600k … and everything above, below and in between. See the chart below for a reasonable justification for questioning all data.

Listing stats.jpg

Download the full 3rd Quarter Market report here or click through to read an embedded version.

Read More

What is the list to sales price ratio for homes in Charlottesville?

I have long told my daughters to question everything and never accept at face value what they’re told. Same goes for real estate data.

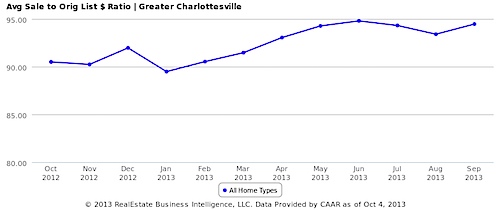
What’s the list to sales price ratio for homes in Charlottesville?

Avg Sale to Orig List $ Ratio - Greater Charlottesville

It’s a good question.

The list to sale ratio is a great number to know – whether you’re buying a home, selling a home (or advising buyers or sellers). This ratio is a solid indicator the movement of the market, whether sellers are pricing well and correctly and whether buyers are paying close to asking price. Unfortunately, at its aggregate, it’s a garbage number. If you’re trying to use this data point as you try to figure out the market – ask questions. Always.

I randomly picked 10 sold homes from the Charlottesville MSA across the price ranges from $100k to one million. (I did this last in 2010 in which I chose 6 homes … the results were the same.

– No foreclosures or short sales

– Sold in September 2013

– No new construction

– Determining Days on Market was a challenge as well. Some of the homes I selected were on the market for less than 30 days while I made an editorial

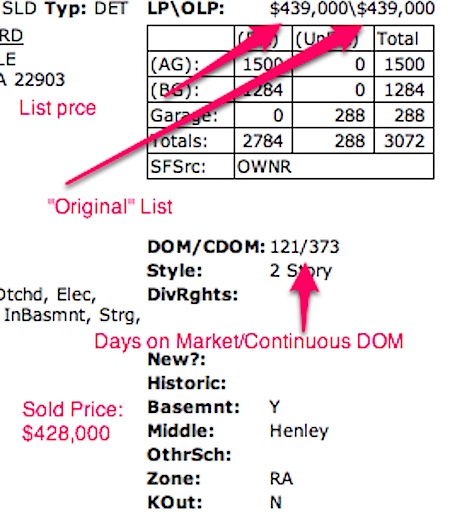
Take the below for example. The “Original List Price” for this listing was $439,000. The actual original listing price was $510,000 – when the home was listed previously with another firm.

– Taking the top level analysis from the MLS yields: the list to sales price ratio was 94.9% of asking price.

– Running the numbers manually puts the ratio more in the 88% range. (if you were to include the listing prices from the original list date ~ 4 years ago …)

– The real, actual list to sales price ratio for the randomly-selected homes – just over 80%.

This story is neither scientific or necessarily representative of what the market-wide list to sale price ratio may be. This is merely a reminder to question. Everything.

Continuous-days-on-market.jpg

Read More

Costco at Stonefield Getting a Gas Station?

Charlottesville Tomorrow reports that the Albemarle County planning commission recommended approval for the Costco gas station. In a completely non-snarky way, I’m wondering how what input the Albemarle County Architectural Review Board will have as to how to integrate Costco and its gas station so that it is compatible with surrounding “historic sites“. Some googling reveals some fairly generic designs … Low expectations may be in order.

Also, will this Costco have solar panels?

Read More