Just release by the Charlottesville Area Association of Realtors, the Third Quarter Real Estate Market Report provides a reasonable high-level overview of where we are. … Realistically, this report likely doesn’t speak to you if you are actively considering buying or selling in the Charlottesville area right now. For that level of analysis, it is important to look at the area, the county, the neighborhood, the street, house type, etc. But in the meantime, enjoy: Third Quarter Real Estate Market Report (pdf)
Posts tagged Market statistics
Friday Chart – Is this the New Normal for the Charlottesville Real Estate Market?
Looking at the number of transactions so far this year* in the Charlottesville MSA – Charlottesville, Albemarle, Fluvanna, Greene, Nelson – for all kinds of property – condo, attached, single family, farms … in this dataset there are going to be outliers and anomalies, but with a set this large, we’re really looking for trending analysis. … Maybe we are witnessing the “new normal” for the Charlottesville real estate market, and it’s something that we’re just going to have to get used to.
…While dramatic increases in productivity could theoretically take up the slack, that may be too much to ask of a generation whose education, for the first time in American history, ranked in the bottom third of developed nations. … “The trend is most visible,†they write, “in the transition from a G-7 to a Group of 20 model of international decision making which includes influential and deep-pocketed developing countries like Brazil, China, India, Saudi Arabia and the United Arab Emirates.
Making Sense of it All – Where Is the Charlottesville Real Estate Market Going?
At the very least, I would venture to say that with housing starts and homebuilders’ stocks failing to reach new lows after hitting bottom well over a year ago, one can say with some degree of confidence that we have seen the worst of the housing recession.
…This trend — increased “outflow” and slightly reduced “inflow” foreclosure activity — means that lenders and loan servicers are 1) giving up on modifying mortgages when the borrower can’t pay, and instead repossessing homes and auctioning them off, but also 2) trying to manage the foreclosure pipeline to minimize the downward pressure on home prices. … For starters, a multiyear tidal wave of foreclosure sales has been inevitable ever since the housing bubble burst: Too many people had mortgages they couldn’t afford to pay, mortgages with a face value higher than the home’s new market price. … And then I’m hearing that: – There are 7 million foreclosures in the pipeline – what might those do to housing prices? – Some banks are seeking to vacate the lending business altogether. (from a conversation, no link) – Banks are delaying short sales in anticipation of Here’s the problem with politics – while I appreciate the necessity to achieve a “balancing act” it’s time to make a decision.
List Price to Sale Price Ratio in Charlottesville’s Real Estate Market
I ran the automated “competitive market analysis” report in the Charlottesville MLS and the price-to-sell percentage was 94.6%, meaning that houses that sold in August sold for about 94.6% of the asking price. … I picked six. – One property that looks like it sold for 100% of the asking price actually sold for – after it was pulled off the market and switched Realtors – 77% of the original asking price , was a foreclosure and last sold for $174,900 in March 2003. – Another one looked like it sold for 100% of the asking price actually sold for – after it was pulled off the market and switched Realtors – 93% of the actual original asking price . A non-foreclosure that last sold for $300k in May 2007 (and was being marketed then as “priced at 2007 county assessment”). – One in Crozet looks like (and actually did) sell for 80% of the original asking price. (and the listing agent is marked as handling both sides of the transaction) – A home in Ivy sold for 94% of the asking price, and the seller paid $5k towards the Purchaser’s closing costs. – Lastly, one that sold for $945,000 – 96% of the asking price – actually sold for 66% of the original asking price – nearly two years ago. – One was new construction that looks like it sold for 107% of the asking price – in zero days on the market. … The data and reports that you read that talk about the Charlottesville real estate market, the Virginia real estate market and the nation’s real estate market probably don’t give you the insight or the guidance that you need to make the decision that you need to make.
Proof that Price Matters
Now, Redfin provides statistical proof . 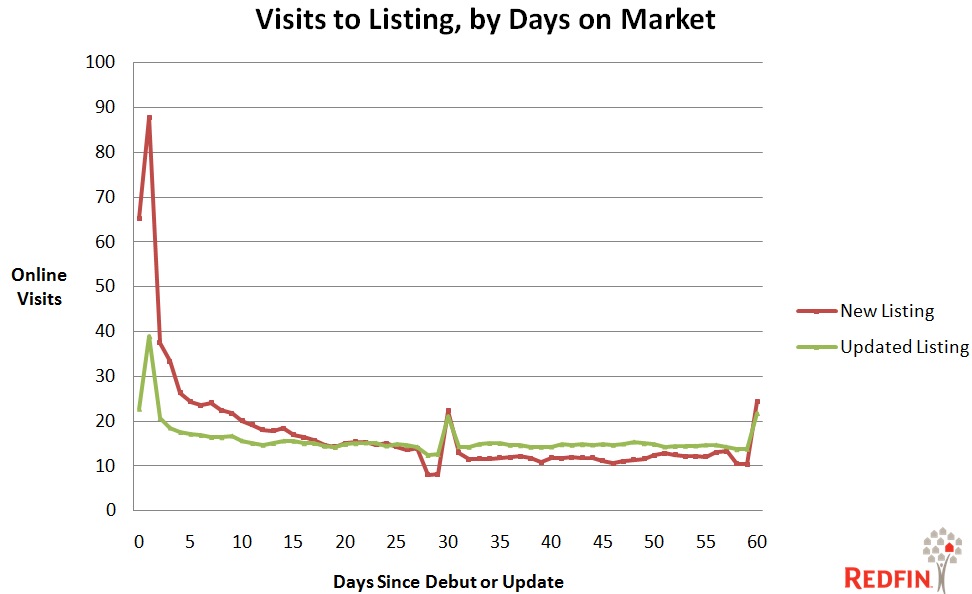 Damn, it’s easy for me to say, “price your home right,” when I’m not the one faced with the life decisions that you or my clients are. But that’s what sellers in the Charlottesville area and virtually every other market in the country are facing – life decisions . … It’s easy to tell my clients “I know you bought for $400k, but if you want to sell and move on, you need to put your house on the market at $335k in order to 1) beat the competition and 2) be priced for the market” – two similar but different dynamics – but it’s much harder to act on this advice. … All I can do as a Realtor is advise my clients and potential clients of where the market is and how they fit into it.
National Housing Numbers Mean What for the Charlottesville Real Estate Market?
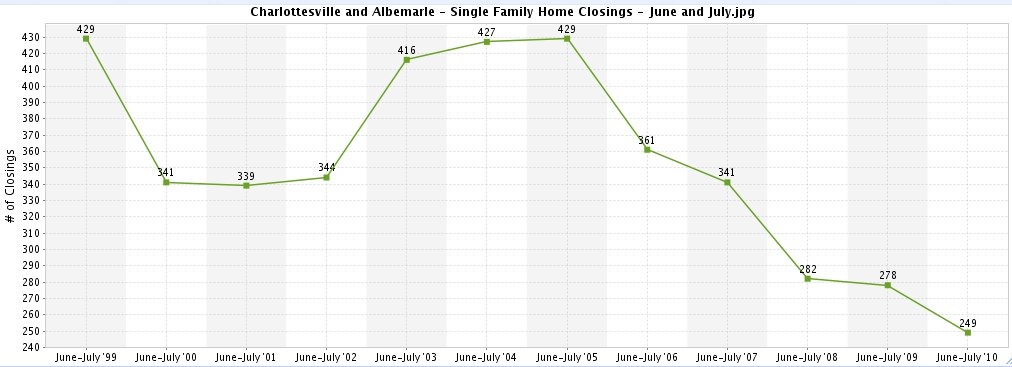
I was saving this post and data for Friday, but the release of the national housing data spurred me to publish today. … * Charlottesville and Albemarle Attached home sales – June and July for the past decade : 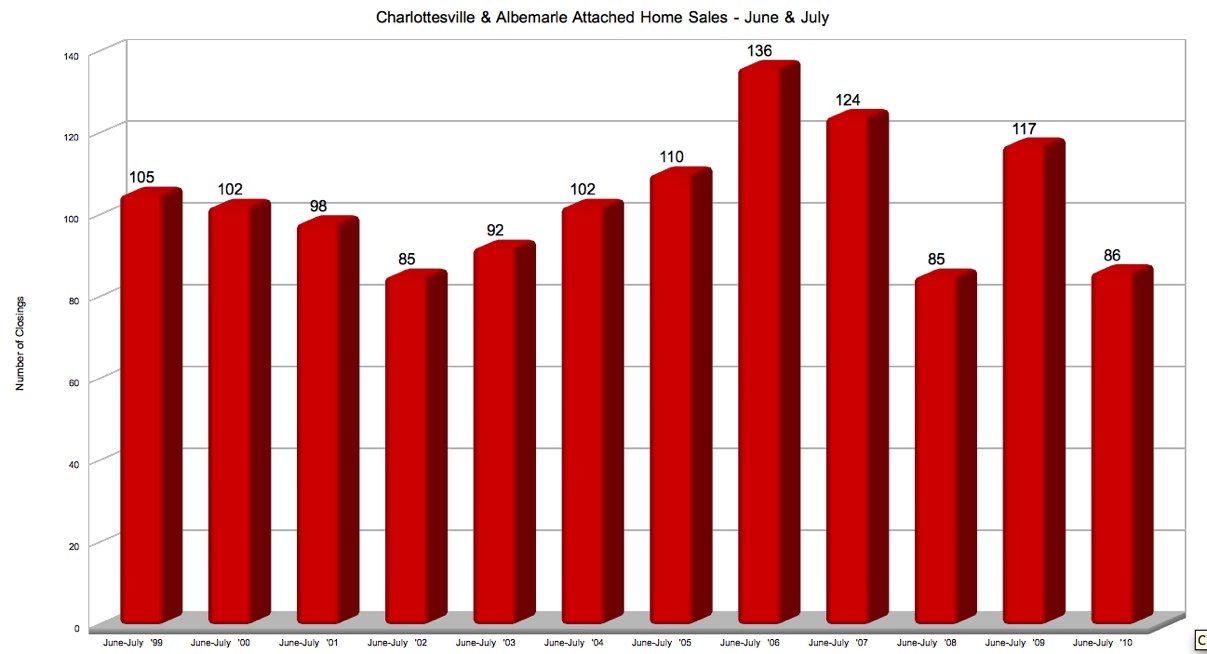 Charlottesville and Albemarle Single Family home sales – June and July for the past decade :
 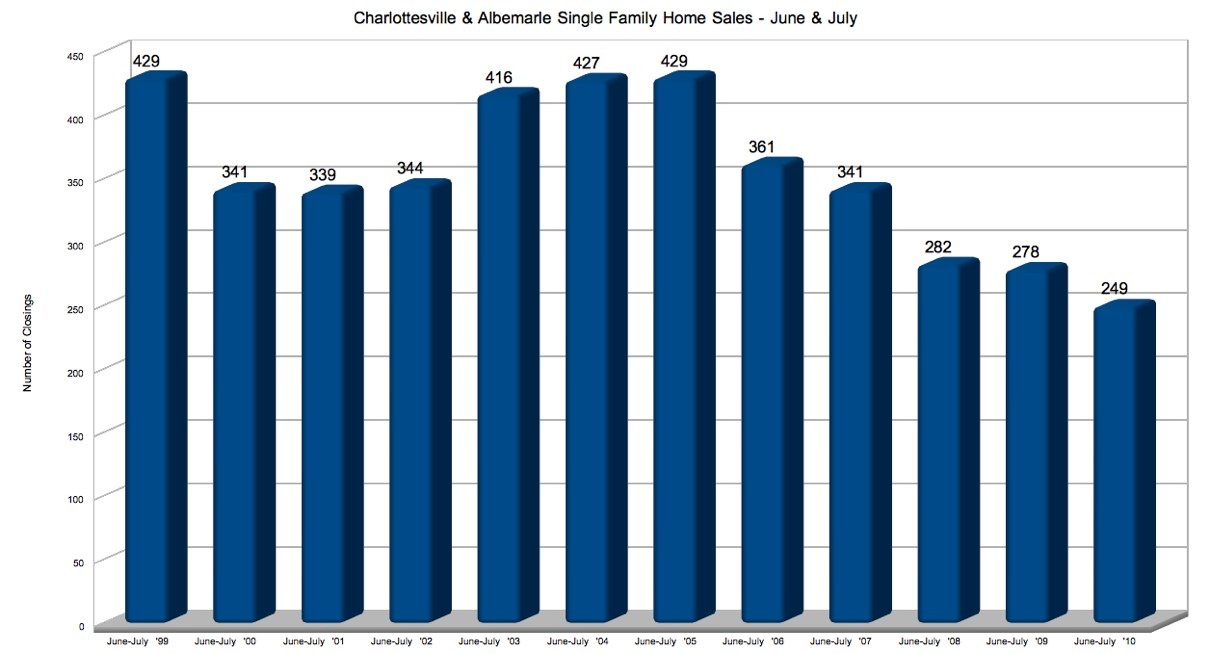 Charlottesville MSA Attached Home Sales – July for the past decade :
 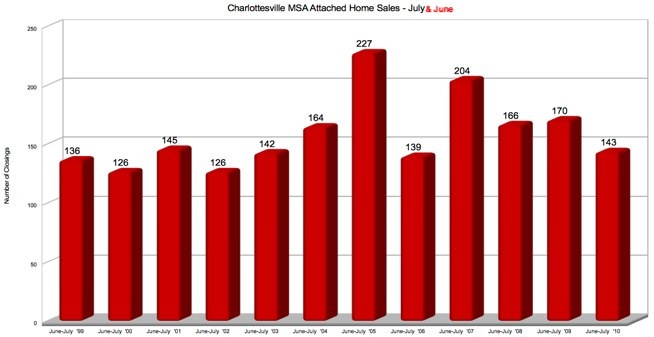 Charlottesville MSA – Single Family Home Sales – June and July for the past decade :
 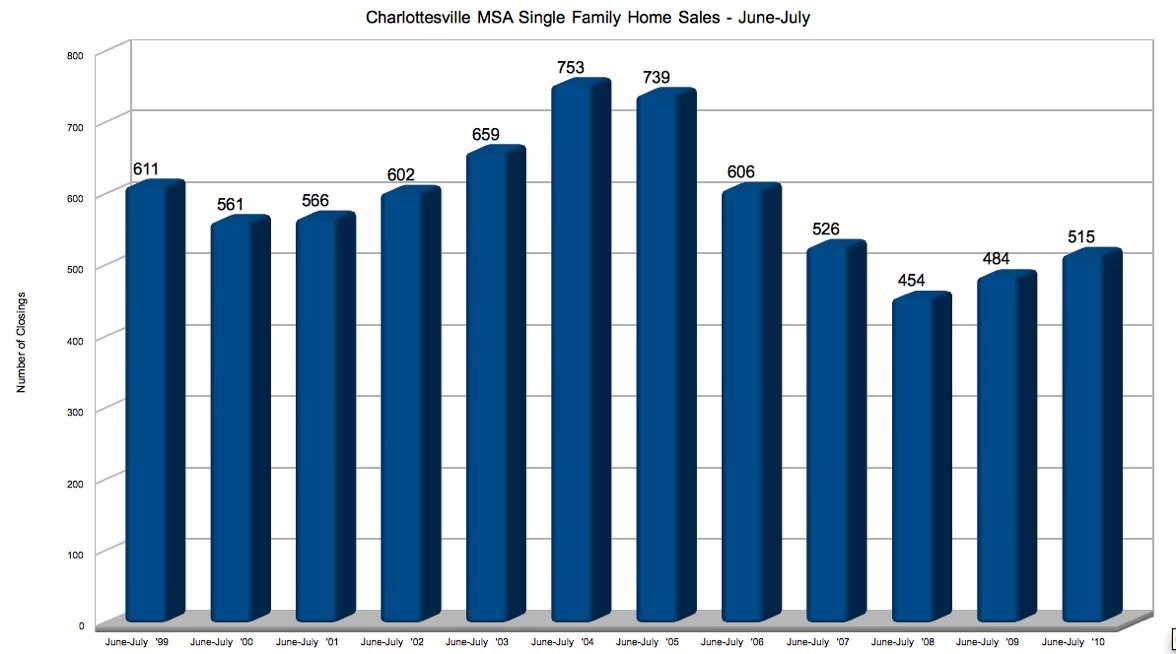 So … what are home prices doing in the Charlottesville MLS**? – The moving median price for the past 200 days shows stability . – The moving median price for the past 90 days shows what may be a coming decline. – The moving median price for the past 200 days shows stability . – The moving median price for the past 7 days shows that the Charlottesville real estate market has transactional volume sufficient to be swayed by even a few transactions.
 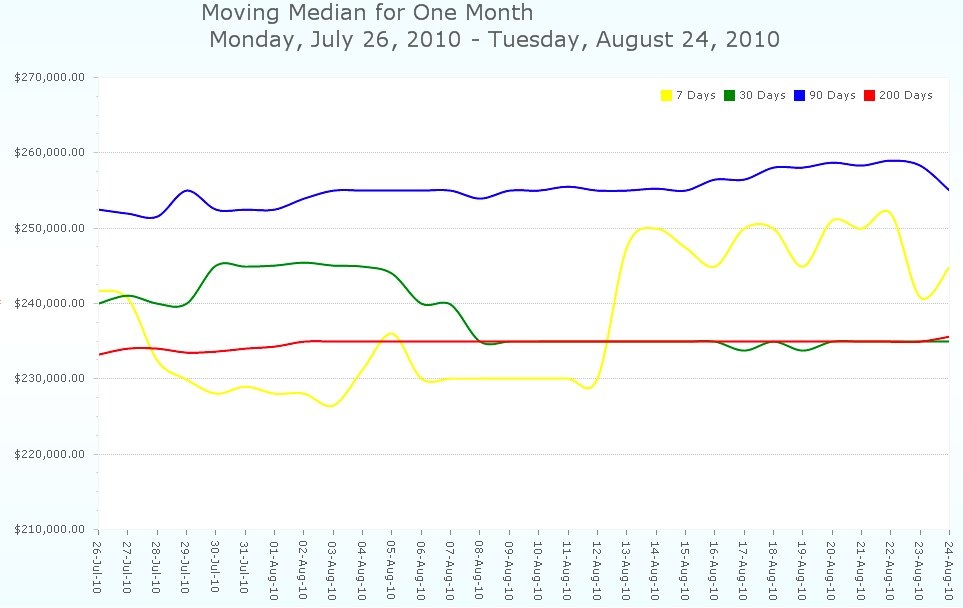 Looking at the moving median home price for the Charlottesville MLS for the past year,we see the spike attributable to the housing tax credit and either what could be the bottom or the first dip.
 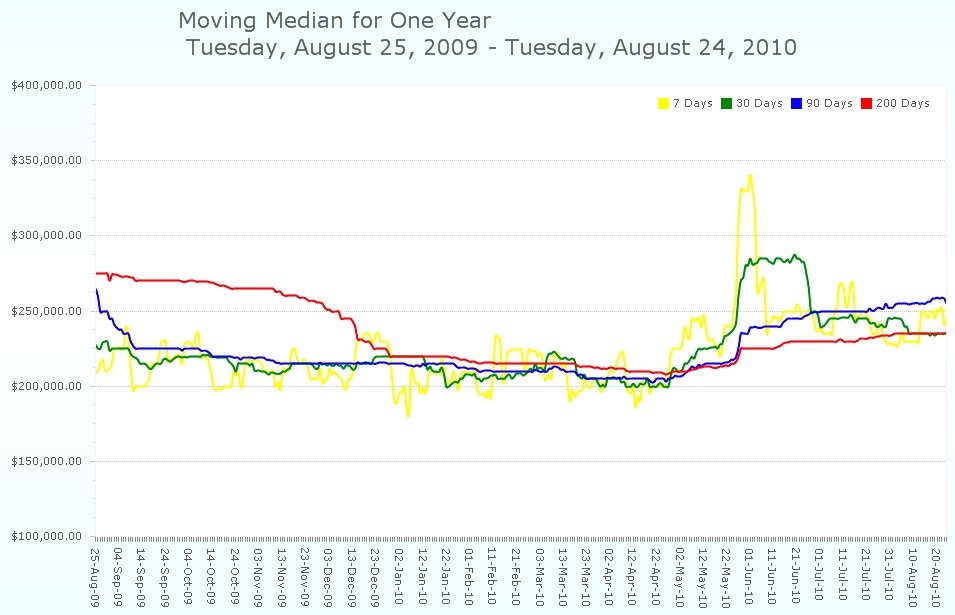 And now for the past five years:
 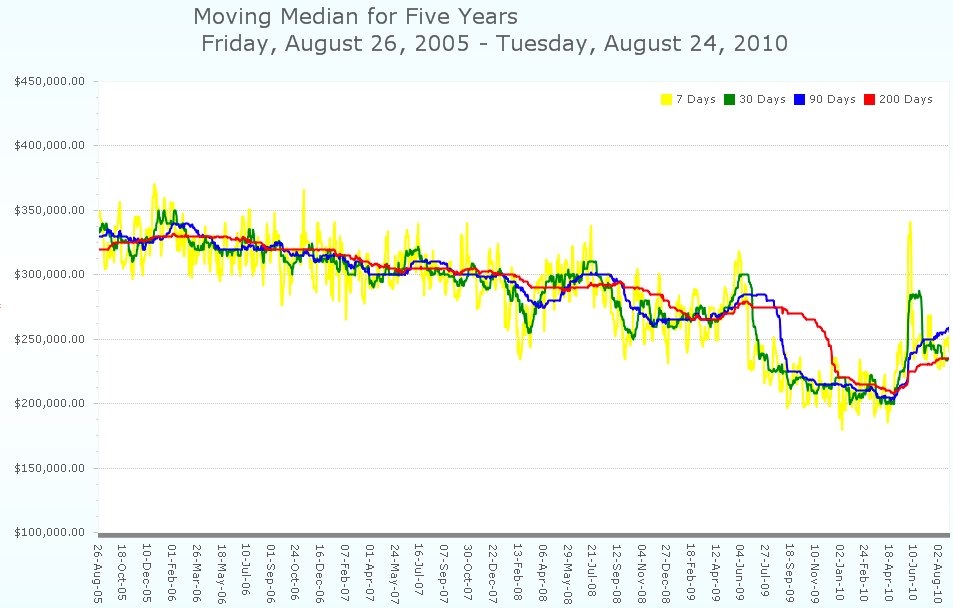 And really, if you’re surprised by this drop, you haven’t been paying attention ; we’ve been seeing these trends in the Charlottesville housing data for quite some time . ” But no matter when one thinks summer ends, it’s already way past obvious that the Obama administration’s “Recovery Summer†has been and will end up being a big, fat, embarrassing failure. … Related News: Housing: No Longer A Sure-Fire Wealth Builder – The Big Picture The Impact Housing Inventory Has on Prices – Keeping Matters Current Housing Market Insight – Week of August 23rd – Bigger Pockets Blog Housing: Still Widely Misunderstood – The Big Picture Existing Home Sales Plummet 27& – The Big Picture Existing Home Inventory decreases 1.9% Year-over-Year – Calculated Risk Existing Home Sales lowest since 1996, 12.5 months of supply – Calculated Risk * You won’t find this data anywhere else.:) ** Charlottesville MLS = Charlottesville, Albemarle, Fluvanna, Greene, Nelson, Louisa …
Closings Down in July in Albemarle and Charlottesville
If the fact that home sales are down, relative to previous months and years, comes as a surprise to you, you probably haven’t been paying attention. … And part of that “is” is that last month in Charlottesville and Albemarle, 85 single family homes closed and 22 attached homes closed. … Attached Home Home Closings in July for the past ten years : 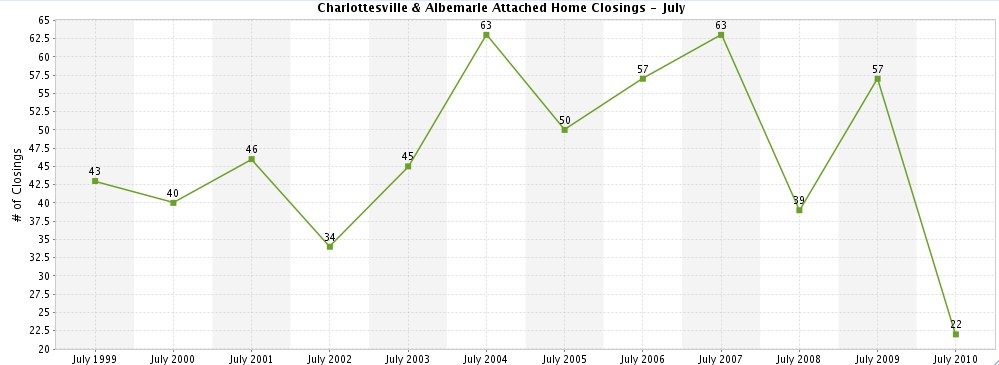 Single Family Home Closings in July for the past ten years :
 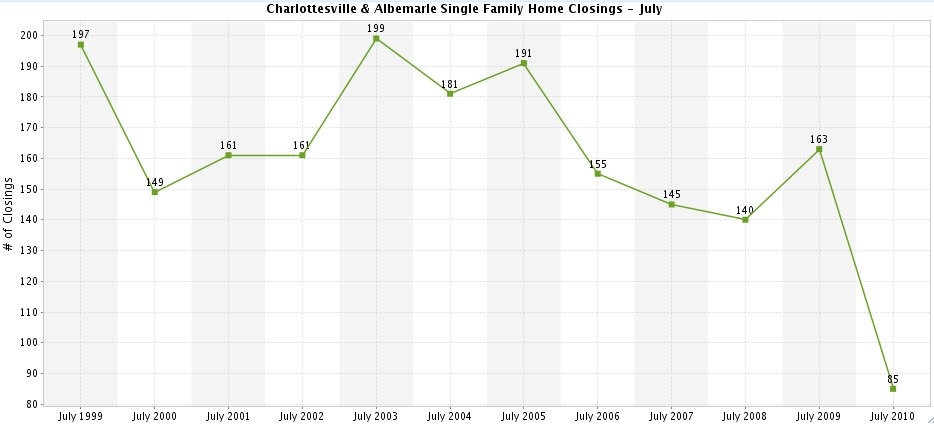 Now, looking back of June and July for the past ten years … The Spike in 2009 seems to be new construction attached properties in Abington Place , Brookwood and the Pavilions at Pantops (more on new construction’s impact on MLS data in a later post).
 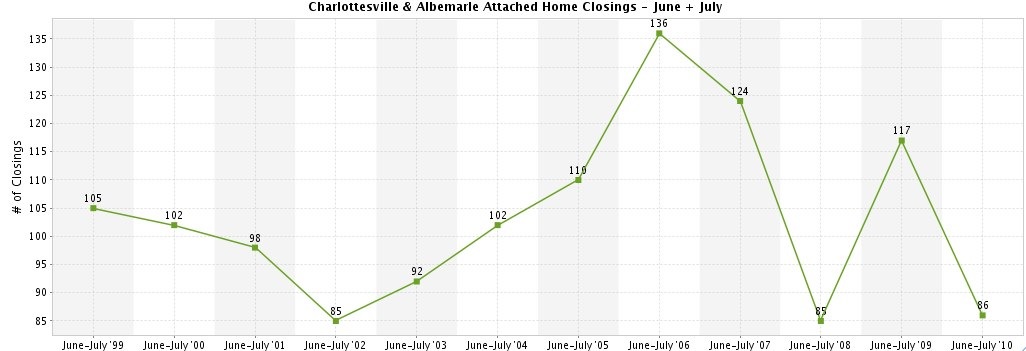 Single Family home closings in Charlottesville and Albemarle for the past ten years: