Keep in mind that below we’re looking at the moving median price for the entire Charlottesville MLS – inclusive of the Charlottesville MSA (Charlottesville, Albemarle, Fluvanna, Greene, Nelson) as well as outlying areas such as Madison, Waynesboro, Rockbridge, etc. … But … it seems that the median price has been increasing after the expiration of the homebuyer tax credit . 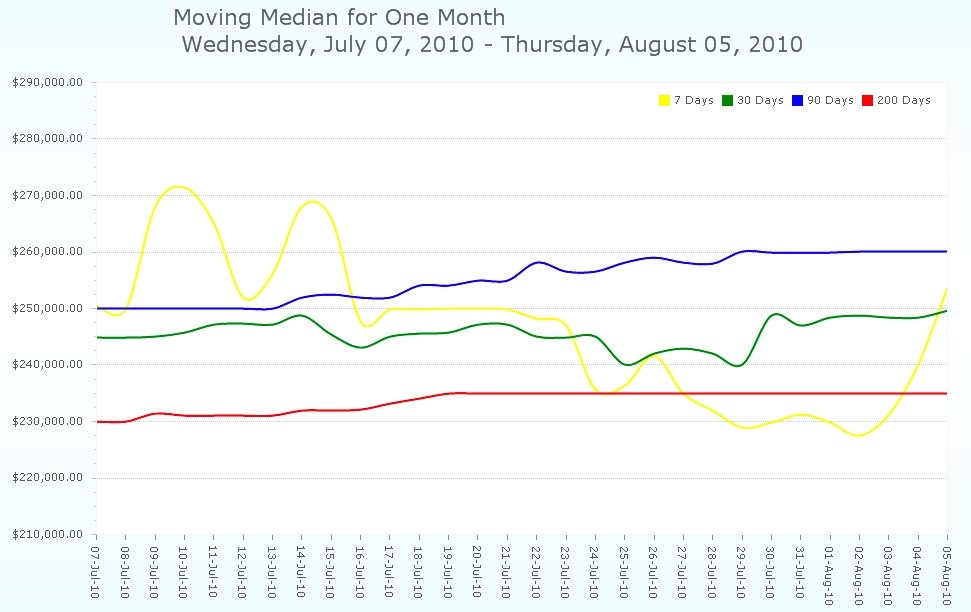 Looking at the moving median price for the past year …
  And for the past five years … I wish this chart allowed for more than five years, but stay tuned, we have some interesting things in the works at Nest .
 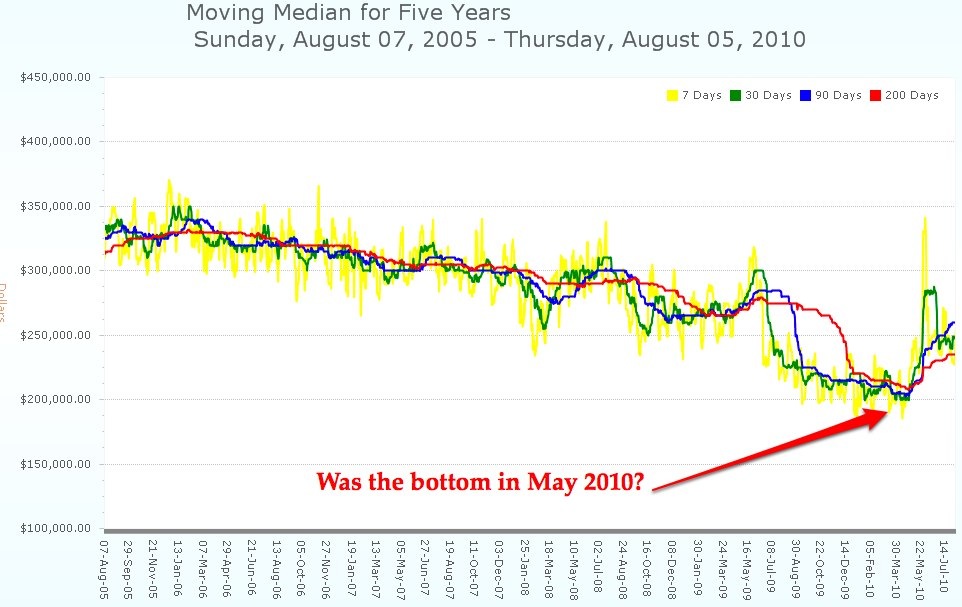 See all posts in the Friday Charts series . … Foreclosure charts courtesy of RealtyTrac : For Albemarle County:
 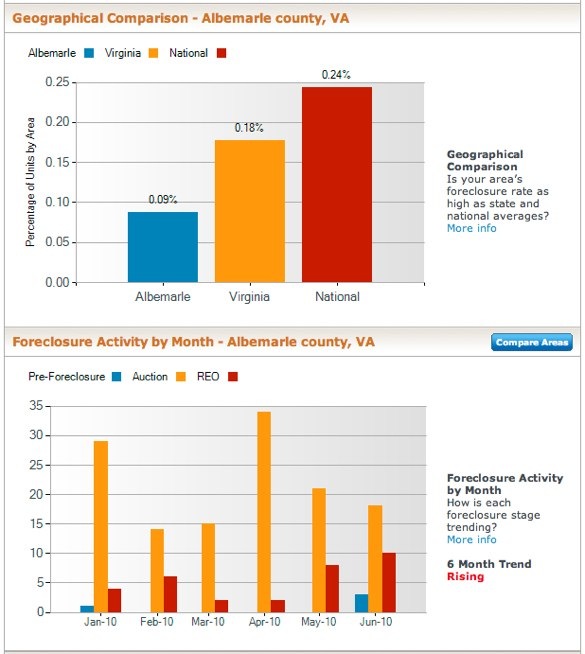 For the City of Charlottesville :
 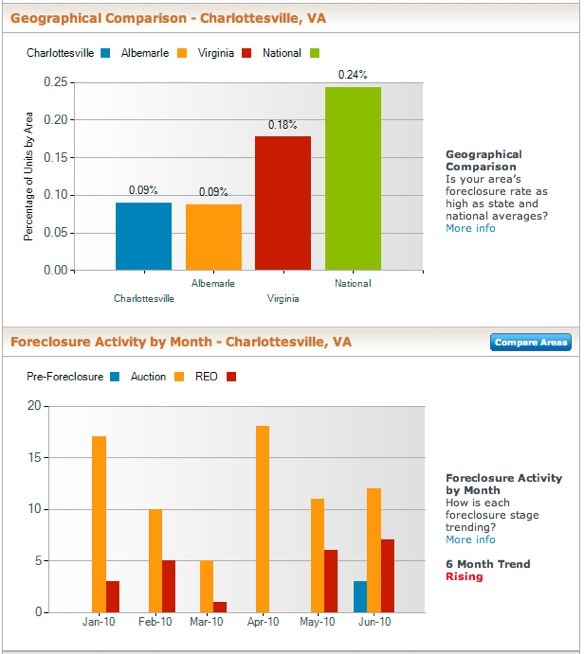 For Palmyra in Fluvanna County , which includes Lake Monticello : (they have more foreclosures per capita than Charlottesville or Albemarle)
 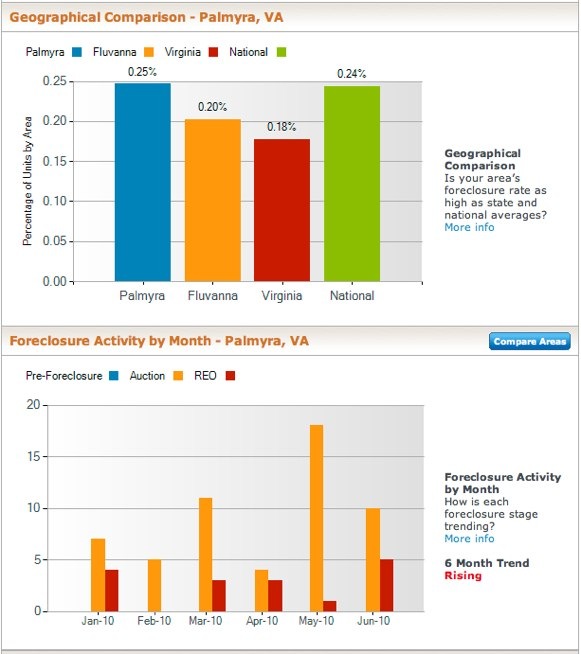 Of course, God only knows what our government might do … all of our analysis would be for naught.
Posts tagged Market statistics
Days On Market Matter in Charlottesville
Slightly longer answer – I’d also wager that of those 47 homes that went under contract in the first 30 days, their selling price is probably closer to the original asking price than those homes that were put on the market 120 days ago.
… Think about it – while you might put your home on the market for $400k and it’s really worth $370k, the buyers know this . You likely won’t sell your home in the timeframe you need or want to; when you reduce your price to $380k in three months, you’ve (probably) been making mortgage payments and delaying the move to the next phase of your life that is dependent on selling your house.
…Schools in the Charlottesville area start around the third week of August (Albemarle – PDF), and we have about three months left before the annual doldrums set in.
Second Quarter Charlottesville Real Estate Market Report
The second quarter real estate market report has just been released by the Charlottesville Area Association of Realtors. Happy reading. 2010 2nd Qtr CAAR Market Report
Mid-Year Charlottesville and Albemarle Market Report – 2010 (Part 1)
Looking at the real estate market data for the Charlottesville market – or any market in the US – is skewed by the homebuyer tax credit, which has been demonstrably proven to have pulled demand forward to the first quarter of 2010. … Now for some Second-Quarter context : First, the obvious – when looking at the historical market data for Charlottesville and Albemarle, as single family homes’ prices increased, buyers looked to attached homes and condos. … One way to look at the numbers above is to say that, last year we didn’t have the homebuyer tax credit; without it this year, the number of contracts written in Charlottesville and Albemarle would have been much lower. … Another way to look at it is that the buyers this year were going to buy anyway, and that the homebuyer tax credit was simply a bonus .
When Evaluating the Charlottesville Real Estate Market, IGNORE National Data
Take your lede : – Home sales up 14% in Charlottesville and Albemarle year over year. – Home sales up 19% in Charlottesville MSA year over year. – Foreclosures continue to climb in Charlottesville and Albemarle. – Questions abound regarding second half of 2010; where will we find the bottom of the market? – If you have questions about or would like more detailed analysis, please contact me.
…Simple (though notsoumuch in reality) What I’m reading: – Harvard’s State of the Nation’s Housing Market (PDF) and listening to an excellent podcast with Nicholas Retsinas , Director, Harvard University’s Joint Center for Housing Studies . (did you know that there was an exhibit at the Smithsonian on McMansions ?) – Core Logic’s Home Price Index Report for April 2010 – Virginia’s Housing Price Index, for single family homes year-over-year, is up 6.5%; for single family homes excluding distressed properties, is up 3.6%. Virginia is one of the five best states for year-over-year price appreciation excluding distressed sales .. but mostly that’s irrelevant in my opinion as the bulk of those sales are most likely comprised of Northern Virginia sales. – The Federal Housing Finance Agency’s House Price Index for First Quarter 2010 The FHFA (formerly OFHEO) say that in the Charlottesville MSA house prices have dropped 6.98% year over year, 1.86& in the 1st Quarter 2010, and have appreciated 12.68% over the past 5 years .
… Home Sales are Up 19% year over year in the Charlottesville MSA: 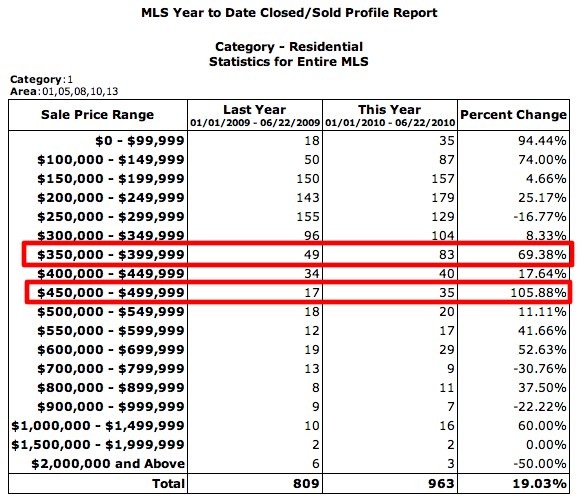 Homes sales are UP 14% in Charlottesville and Albemarle :
 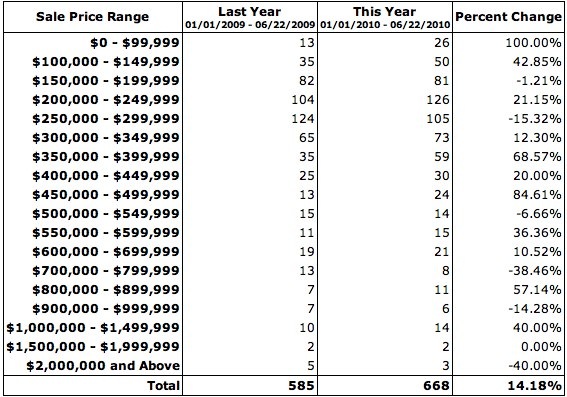 One point: Charlottesville’s Unemployment is lower than the national average.
 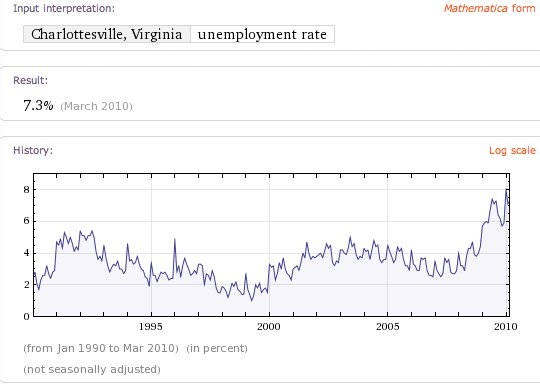 Prime example of the irrelevance of national, aggregate housing data, which is good only for political talking points and respective agendas: Foreclosure starts for the nation and Charlottesville and Albemarle: National foreclosure data, courtesy of the HUD Scorecard, using RealtyTrac data:
 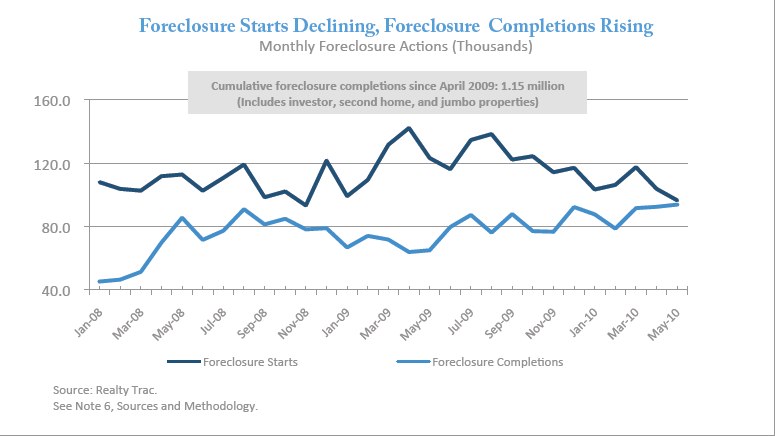 For Charlottesville, using RealtyTrac :
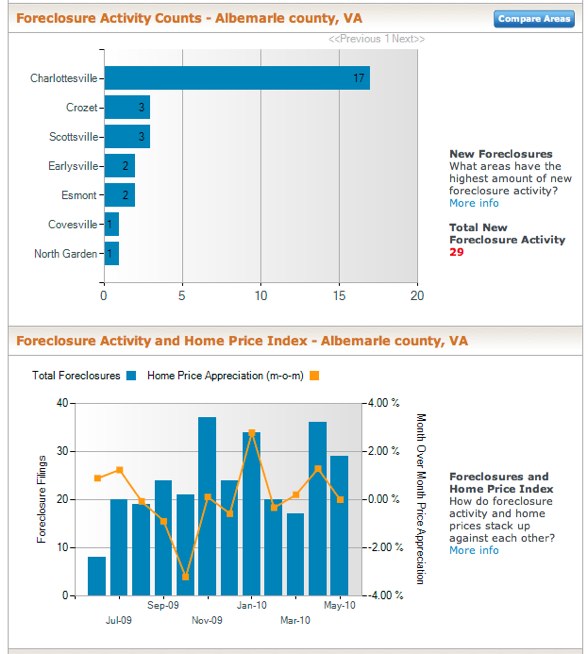
 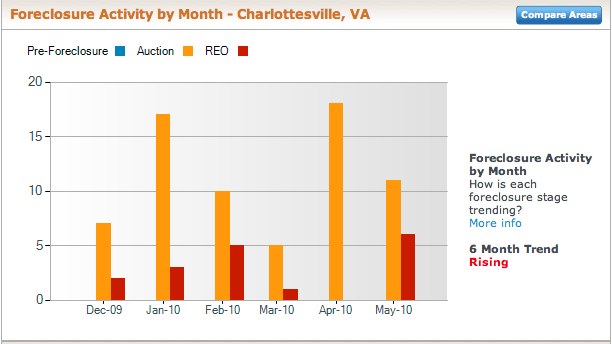 For Albemarle County, using RealtyTrac:
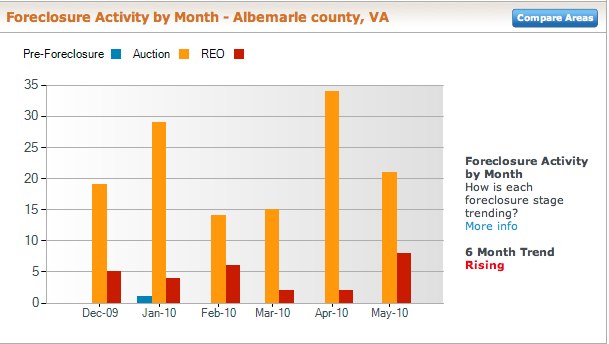
 What have median home prices done in Charlottesville over the past five years?
Dealing with Home Buyers’ New Psychology
When we started, we were looking at new construction, and I had to tell them that whatever they wanted changed would have to be done by them, at their expense after closing, as the builders were not going to make any concessions or alterations. … That’s a difference that matters – both to actual sales numbers and perceived sales numbers – to the market’s collective psyche, if you will. See for yourself (PDF). Add to this the fact that the average Days on Market in May 2006 was 69 and the average Days on Market in May 2010 is 106 and the market rightfully feels slower.
…Many Sellers don’t want to “give their homes away” (hint: price your home to sell from Day One ) and many Buyers want to feel like they get a “deal” and many buyers have unreasonable expectations – resale homes are used homes; they are not new construction.
…They also are prepared to walk away if things don’t go their way – there will be another house that suits their needs and wants; five or six years ago, another house would come on the market, but it would probably have been more expensive.
Vacant Homes for Sale in Charlottesville and Albemarle – June 2010
In January of this year, I looked at the number of vacant homes for sale in Charlottesville and Albemarle . … 2 – Sometimes the sellers are more negotiable, basing their asking prices on what the house is worth rather than what they need to make. As with all homes for sale, there is no rule, consistent percentage to offer under asking price, rhyme nor reason to sellers’ motivations to sell or price.
… Related Posts : Vacant homes in 2007 Vacant Homes (January 2007) Consistently Vacant Homes in Charlottesville (2008) Vacant Homes and Homeowner’s Insurance Raw Data :