One big notation: I’m no longer comparing today’s real estate market; what happened in 2005 – 2007 and before is interesting, curious, anomalous and ultimately irrelevant to today’s real estate market. EVERYTHING is different now – interest rates, economic outlook, international economic events, gas prices, employment trends – making comparisons between this market and that market is a distraction.
The City of Charlottesville’s real estate market is unique – its mix of homes – single family, condo, townhouse, the fact that is has a relatively smaller percentage of newer construction and its more dense and urban location make it quite distinctive from the surrounding markets.
First, the bullet points:
– Active Listings – Fewer than last year, but still too high.
– New Listings – Fewer than the past two years and trending down; this is a very good thing. As fewer houses come on the market, more houses will sell and we’l be able to find our way through the current spate of houses on the market. *
– All Pendings (Under Contracts) – Higher than the last two years; this is a very good thing. People are buying real estate.
– New Pendings (Better reflecting current market activity) –
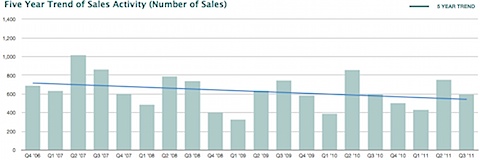
– Sold Listings – Slightly higher than last year.
I’d love to include the numbers and charts for Days on Market and the List Price to Sales Price ratio, but I have found that the only, only, only way to run these numbers with any degree of accuracy is to do it manually. For specific properties and neighborhoods.
Note also that these numbers and charts are for everything – single family, attached and condos – your market will vary.
* I’m not totally convinced that the houses that are coming on the market in the Charlottesville and Albemarle real estate market are the ones that buyers want to buy – whether size or energy efficiencies, I think that the inventory we’ve seen over the past 18 months has not quite matched to what buyers want, and this is a reason that we’ve seen the new construction market in the Charlottesville area do so well.
Now, the charts and graphs …


