I have long told my daughters to question everything and never accept at face value what they’re told. Same goes for real estate data.
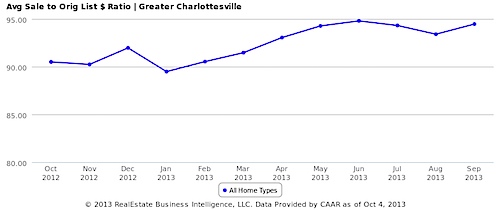
What’s the list to sales price ratio for homes in Charlottesville?
It’s a good question.
The list to sale ratio is a great number to know – whether you’re buying a home, selling a home (or advising buyers or sellers). This ratio is a solid indicator the movement of the market, whether sellers are pricing well and correctly and whether buyers are paying close to asking price. Unfortunately, at its aggregate, it’s a garbage number. If you’re trying to use this data point as you try to figure out the market – ask questions. Always.
I randomly picked 10 sold homes from the Charlottesville MSA across the price ranges from $100k to one million. (I did this last in 2010 in which I chose 6 homes … the results were the same.
– No foreclosures or short sales
– Sold in September 2013
– No new construction
– Determining Days on Market was a challenge as well. Some of the homes I selected were on the market for less than 30 days while I made an editorial
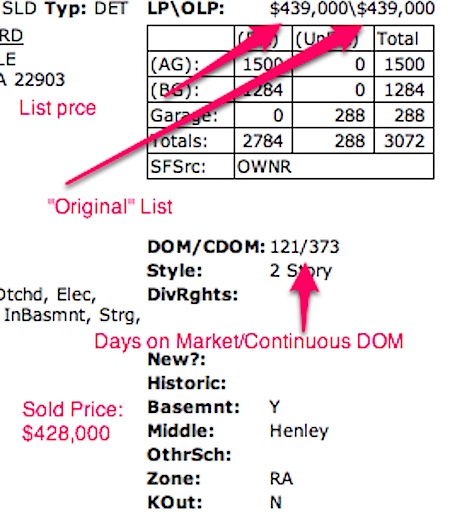
Take the below for example. The “Original List Price” for this listing was $439,000. The actual original listing price was $510,000 – when the home was listed previously with another firm.
– Taking the top level analysis from the MLS yields: the list to sales price ratio was 94.9% of asking price.
– Running the numbers manually puts the ratio more in the 88% range. (if you were to include the listing prices from the original list date ~ 4 years ago …)
– The real, actual list to sales price ratio for the randomly-selected homes – just over 80%.
This story is neither scientific or necessarily representative of what the market-wide list to sale price ratio may be. This is merely a reminder to question. Everything.
Read More


