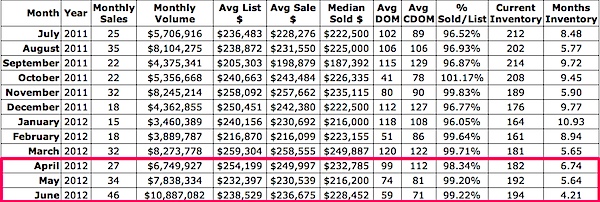
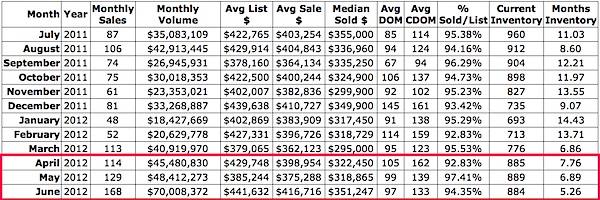
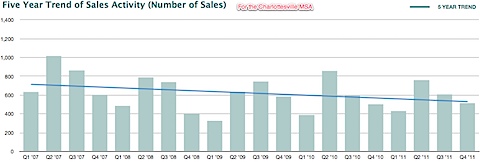
I hadn’t updated this chart in about 18 months, and I was curious … one of the most common questions I get is “when do homes come on the market in Charlottesville?” Typically this question comes in one of three conversations: (I’m going to do a series answering these questions – to be published the next two Wednesdays) –
– I’m thinking about putting my house on the market – when does the Charlottesville market start? (short answer: Take pictures now)
– I’m thinking abut buying a home in the spring – when do most homes come on the market? (short answer: Fall/Winter is the best time to begin your home search. And an even better time to hire buyer representation so your search process is less frustrating, more efficient and better.)
– I’m curious. What’s the market like? (note the third chart to see what my curiosity led me to)
A few differences between the following charts and the one from January 2011:
– “Charlottesville” = Charlottesville, Albemarle, Fluvanna, Greene, Louisa, Nelson (in 2011 I didn’t include Louisa)
– Only Single Family, Attached and Condos results are included – not “proposed” – meaning not new construction, paper lots, aren’t included
That said –
Let’s look at some numbers. 2011 was interesting, with the new listing bump breaking the traditional mid-year inventory decline right after the start of the autumn school year – a trend that occurs every year.
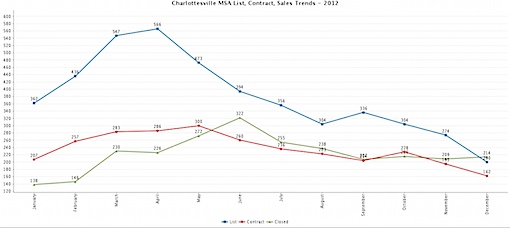
And 2012?
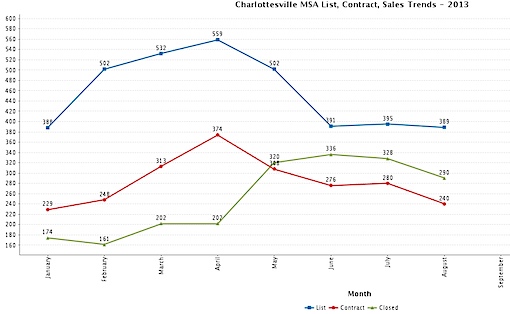
So … how’s 2013 looking?
– The contract peak was in May of this year versus April of 2012 – As I said in my monthly note recently, the frenzy of the early spring filled with hope and confidence was tempered early.
– Inventory levels for 2013 are pretty much on track – across the MSA – with 2012.
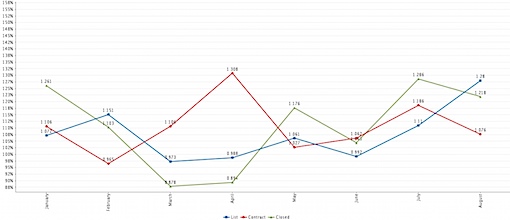
The differentials between 2013 and 2012 are fascinating. Look at the peak in Contracts.
– I’m speculating that the increase in inventory in July/August is due in part because some sellers saw the hope in the market and success their neighbors were having in selling and thought that now would be the right time for them to try to (finally) sell.

