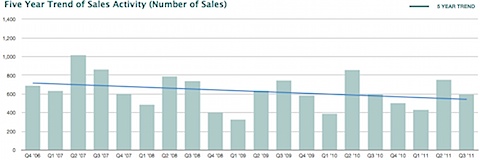
More to come. In the meantime, have a look at the market report.
CAAR 3rd Quarter Real Estate Market Report – 2011
This post will be updated throughout the day as I get opportunities to look at the data. …
Notes:
– The above report is for the entire Charlottesville MLS area, not Charlottesvill and Albemarle or even the Charlottesville MSA (Charlottesville, Albemarle, Fluvanna, Greene, Nelson) or even the Charlottesville MSA + Louisa. So take it for what it’s worth – a very broad overview of the entire Central Virginia region. Example: in Amherst, Augusta, Buckingham, Goochland, Rockbridge and Lexington, there are 156 closed transactions in our MLS … which isn’t particularly relevant to real estate consumers in the Charlottesville area.
– Days on Market is not statistically accurate, as it does not reflect relistings of properties.
– The Charlottesville market is still declining.
– Detailed market report from Nest coming soon, as is county by county break down.
– Townhouse/Attached median sold price is down in the Charlottesville/Albemarle area, in no small part due to Ryan Homes’ driving prices through the floor market-wide.
– Median sales prices are down, but inventory is down as well; the latter qualifying as a good data point.
– What questions do you have about the market data?
Interactive Charts are after the jump; I choose to use the static charts rather than the interactive reports as I don’t like to be locked into a service; I pay $30 a month for access to the deeper data and if I choose to not pay for the service, the interactive charts go away … not a good option.
Read More


